An introduction to mobile app analytics
Mobile app analytics – the most important data indicators
The mobile app market keeps on evolving, supplying us with more and more solutions that we now use daily. Apple and Google Stores are full of interesting ideas to make you think “why didn’t I think of this?”. Some users even say that there are apps that have drastically changed their life. There are countless stories of couples finding love through Tinder, re-gained form thanks to Endomondo and of the big savings of the users of Fuelio or Yanosik. All of those mobile apps have implemented innovative solutions, which left a mark in people’s daily life. However, most developer stories do not start with a flash of genius and some magical materialization of a perfect product. It is usually a result of hard work and changes to the idea based on thorough user analysis – their needs, behavior, sympathy and antipathy – it is a constant evolution. This is why so many of the mobile apps we use today are currently so different from their initial state. Developers cannot afford to stop listening to their clients and making sure that the product keeps on being updated. Below, you can find a description of all of the most essential analytic indicators in mobile apps – they will help you deliver the best product possible. Remember, that if you do not know how to properly analyze the data streamed from your games and mobile apps, paid mobile app marketing becomes practically useless. Those indicators have been divided into 3 main sections:
Mobile app user indicators
Mobile app engagement indicators
Mobile app economic indicators
User indicators
Number of mobile app installations / uninstallations
Tracking the number of downloads of a mobile app is one of the more „visual” ways of grasping its growth. It is of course a big simplification, since popularity is not always strictly related to economic success – however, more does usually mean better. There is of course always a risk that our mobile app is abandoned already shortly after its installation – using such an indicator requires a broader context. It is also important to gather data about the webpage the new user entered the store from. When you have all of the above, the amount of downloads from a given channel can actually properly tell you if you are achieving your goal. If you notice an increase in social media traffic for example, it is a good idea to keep being active and working more in that field. It is also logical that, while looking at the number of installations, you should also consider the number of uninstallations to be able to get a correct view.
User count
The number of downloads and installations of a mobile app, paired with its user count, can give you a good idea of its state – they are not always equal. The user count can be measured by a number of criteria – below, we will present a couple of indicators for the active user count. It is essential that we define what an “active user” is. Depending on the type of mobile app or game we are conducting the measurement on, we can consider a user who has done a certain activity an active user. It could be reaching the next level in a game, sending a message or a friend request. It is not a good idea to consider every user, who opened the app or game an active user, though – in this case, context and our expectations are most important. Being active does not mean the same thing for everybody – and so, it is vital that we are sure what it means to us. Mobile app developers sometimes treat this aspect in a very binary way, which renders the results wrongly satisfying – instead of informative.
DAU – Daily Active Users
DAU (Daily Active Users) is an indicator displaying the number of unique, active users, who, at least once a day, started a session within your mobile app. This type of indicator is one of many others, which function best with additional, contextual data – still, in many cases, even such a small fragment can be quite useful. Such a case could, for example, be launching a marketing campaign. If you expect the users to visit your mobile app daily, DAU is a great starting point for your observation. Some marketers do say, that DAU is not a very informative indicator. However, if we define user activity properly, DAU is great for approximations regarding our monetization model. An example of a definition of an active user, according to Facebook, is a user who logged onto an app or website and used the available functions, for example pressed like. Here, an active user is not one who only used FB plugins on different websites, even if he liked something or shared content. It is very good to be able to, through DAU, distinguish a single user, even if he uses two different devices every day. Those devices could, for example, be a private phone, a company phone or a tablet – if a user is counted as a “new user” on all three, the statistics are ruined. A good solution is to use a verification method through an account name, phone number or e-mail address. This will also help with verification after a user updates his device to a new one.
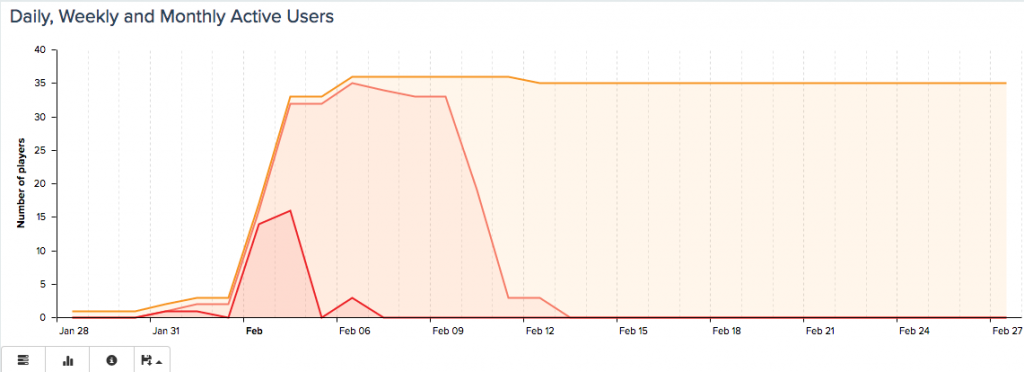
MAU – Monthly Active Users
Unlike DAU, the MAU (Monthly Active Users) indicator’s timeframe is 30 days. This means that an active user has to have done a certain activity at least once in a month – and it does not matter if had done it multiple times or just once.
To calculate MAU, Twitter defines an active user as a user who follows at least 30 other users and is also followed by at least 1/3 of them. If such a user logs in at least once every 30 days, he has qualified for MAU. The use of DAU and MAU can be different depending on the type of your mobile app. A big factor while analyzing the indicators is the so-called “cyclicality” of use of a given app. DAU is more important when analyzing mobile games with micro-payments, while MAU is great for apps that help you book flight tickets. The DAU/MAU ratio is defined as the “stickiness” of a mobile app. While comparing the two indicators, we can determine how often it is that users come back to the app. This value will always be between 0 and 1 and can be expressed as a percentage value. Let’s now assume that the DAU of an app is 2000, while MAU is equal to 10000. This means that, on average, users logged in during 20% of the chosen days, which equals to once every 6 days. In the case of mobile games, a 20% ratio would be a very good result – mobile apps like Facebook Messenger and WhatsApp can however boast a 50% ratio.
Geographical indicators
The way the mobile app market is built allows you to reach users from all over the world. It does not matter whether you have a huge studio or are a small company registered in a garage – your game or mobile app can, without limitations, reach all continents. This fact means that, while developing your mobile app, you should take additional factors into account.
Knowledge regarding the country of origin of your users can be helpful in multiple ways. Let’s assume that, even though the app is available globally, the majority of users come from one region. Analyzing what caused the success in the region and the behavior of its users can give us a recipe to duplicate this victory model in other regions.
While looking at the user outflow in various regions, mobile app developers can often see problems they would otherwise not be aware of. The correct implementation or adjustment of elements of local culture can be the deciding factor of your mobile app’s existence. There is a difference between translating a mobile app and making it viable in a certain region. Let’s look at the calendar – in some parts of the world, the date formats are very different. If your mobile app and its functionality was strongly based on one calendar agenda, it could be rendered useless for the rest of the population. The chosen weight and scale unit systems of can also be important factors – having the option to toggle between them can be a good idea.
The choice of a graphical style or color scheme can also often discourage the users from using your mobile app or game. Tracking the uninstallations or user outflow in a specific region can lead us to discovering problems connected to local culture, often forcing the developers to go with different solutions. Not everyone reads from left to right, for example. For apps, in which you need to swipe in a certain direction to go to the next section, the level of intuitiveness can be different from user to user.
Engagement indicators
Session length
The length of a session is the time of use of an app in a single sitting. Usually, it is assumed that, if a user carries out no command within the app for more than 30 seconds, the session has ended. The session is counted from the moment the app has been opened to the time it has been closed – its length can give an idea of how engaged users are in the app. The average session times are usually very different and depend on the app category. As an example, while launching Uber, we intend to quickly do exactly what we came for. We are only interested in getting a lift, and the developer only needs a short session to collect the revenue. This is one of the exceptional cases of the rule of “the more the better” – generally, and for most categories, the longer the session, the better the cession.
In-app time
Although the saying „the client is always right” does seem a little over the top, it is reasonable in stating that clients should be at the center of every business. In the case of mobile apps and games, the users are what pushes the project forward. Your task is to make sure that they spend as much time within the app as possible. The in-app time of a user is the sum of all the time the user has spent in-session in a day, a week or a month. We have already mentioned the huge competition on the mobile app market – and because of it, the indicator is in fact, in the opinion of many mobile app developers, better at displaying the popularity of the app than the amount of downloads and comments or even the rating in the store.
Session intervals
This indicator helps us determine the frequency of starting new sessions. So far, we have been discussing only single sessions and the sum of their length – this indicator supplies this knowledge with data telling us how quickly the users tend to come back to the app. The app developers wants this time to be as small as possible – if it is alarming, there is no time to waste. From push notifications, mailing and text messages to even social media – you should try to bring the users back into the app in any way you can, through any available channel.
Retention indicator
This is the most often talked about indicator, also called one of the most important, especially in monetization models based on the freemium, in-app purchase model. Measuring mobile app user retention is essential to determining the value of a client. This indicator also tells us what impression the app has made on the user. The higher the retention indicator, the higher the chance of a given user to undertake a certain expected activity, giving you simply more ways of convincing him to use the app.
Since a big part of apps is only used once after being installed, success in this field is very important. To accurately and precisely measure user retention, besides using the appropriate time intervals, you also need to properly classify your users. Diving them into the right sections will enable in-depth analysis, at the same time allowing for more precise action. If your app has a specific group of very engaged users, you should consider them a separate portion of the base – doing so will give you even more accurate results. Do some of your clients quickly abandon the service? You can ask questions like this one and gradually create multiple other groups, divided by, for example, the reason of outflow. Each section should be comprised of other receivers, concern other issues and need unique notifications.
Mobile App User Retention is one of the most difficult issues that mobile app developers have to deal with.
Mobile app activity
There is a plethora of statistics to track and count hiding behind this term. Mobile app activity can be understood as the number of entries to a given section, the amount of clicks on a certain button or simply as the sum of transactions. This indicator has to be defined by you personally – only you can determine what the most important information for your app’s growth is. Even though the point of observation can be a part of the UX, marketing campaign or mobile app functionality, the end user should be the most important element and at the center of your activity.
App Marketing indicators
Conversion
Conversion is the first economic indicator that tells us if our investment expectations are met. For example, if a user visited your mobile app to make a purchase after he had seen your ad on one of your partners’ websites, you could say that the ad converts. The definition itself might sound a bit complicated, but the concept is quite easy to understand. What matters most here is clearly defining the goal you want to reach. This is why conversion can take the form of watching a commercial, clicking on a banner, registering in a mobile app, signing up for a newsletter or even visiting a certain section of the app. What is important is that those actions take place after the app has been reached through a certain channel. Did the newsletter readers connect their social media accounts with their in-game account? If that was the purpose, you can say that the conversion was successful.
We can also use this method to examine the effect of certain CTAs within the app. Let’s say that you inform your users about the option to purchase in-game extras after the completion of a level, encouraging them to press a special button. If the purchase took place, and you can be sure about the source of the traffic, you can also call it conversion. Your actions don’t necessarily have to have only one expected effect. It can for example be that one commercial encourages viewers both to directly purchase a product and to sign up for a price alert system. In this case, we can define conversion for both events. If we achieve the same effect from two different actions, we will also have two different indicators – this time however with a different conversion source.
ARPU
ARPU (Average Revenue Per User) tells us about the average income from a single user of a mobile app or game. Similarly to other indicators, it is calculated with a given timeframe – the indicator is connected to the MAU indicator. ARPU is calculated from a formula: APRU = REV / MAU, where REV is the sum of your income.
ARPDAU
The ARPDAU (Average Revenue Per Daily Active User) indicator shows us the daily income from a single active user. This indicator is closely monitored by mobile game creators – it can show fluctuation, displayed by no other indicator. Unlike ARPU, ARPDAU enables us to precisely calculate the state of our monetization on a daily basis, not a monthly one. This indicator also helps us better interpret the short-term results of our actions. There exists also another, similar indicator called ARPPU, which tells us about the average revenue per paying user. This indicator is an even more precise tool for calculating revenue, focusing only on the sources that you monetize on, and, in the average, excluding the users that do not bring any income.
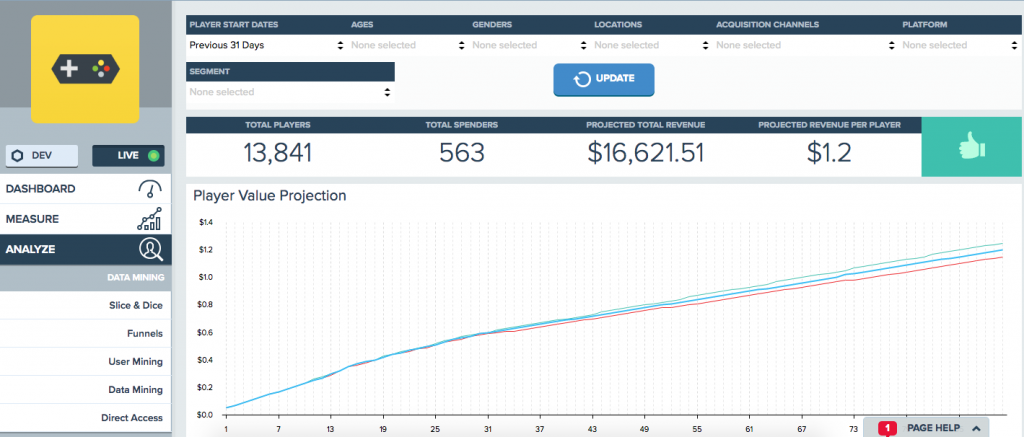
LTV – Lifetime Value
LTV is an abbreviation of „lifetime value”, which is sometimes also phrased as CLV – „customer lifetime value” or LCV. Throughout various sources, we can find almost 20 different definitions of LTV. A well-known economist and professor of Kellogg School of Management, Philip Kotler, defines this concept followingly:
“It is the current value of all of the expected future income sources being a result of transactions with a client in a given timeframe”. In a mobile app, LTV helps us measure the value of a client within the whole relationship – until the settlement of the last transaction of the cycle. This is the most complex of all indicators described so far. At first glance, LTV might seem similar to ARPU, but it is in fact much more complicated. ARPU only considers the average income – LTV has more variables. In mobile app analytics, it is generally stated that, when LTV is higher than the cost of a single installation, an on-going investment return has been reached. Similarly to the varying definitions of LTV itself, there are also a couple of different ways of calculating it. One of those formulae, called “average LTV”, is derived by multiplying ARPDAU with the average retention indicator. The disadvantage of this method is the relatively low reliability in the early phases of your business – the method requires a big user base and a longer time of presence on the market to work properly.
Another method of calculation is based on the outflow indicator, with the formula being LTV = ARPU x (1/outflow).
There are also plenty of other ways of deriving this indicator. For it to be the most useful, the topic has to be deeply elaborated and you should choose the method that is the most appropriate for your economic goals.
Customer Acquisition Cost
Also called Cost per new Customer, with an abbreviation of CAC. This indicator tells you the cost of a single installation by a unique user and the way said user has reached you.
The easiest method of calculation is to sum up the total expenses connected to acquiring new customers and divide it by the number of new clients in a given timeframe. It is, next to LTV, one of the most important mobile app indicators – it helps us determine whether the investment is worth it and the cashflow is positive. By analyzing the ratio of LTV and CAC, it is quite easy to estimate the state of your business. If the ratio is equal to 1:1, you are essentially losing money. A ratio of 2:1 means that you’re on the right track. If the Customer Acquisition Cost has a ratio of 3:1 to the Lifetime Value, the business is working like a well-oiled machine. Interestingly, a ratio of 4 to 1 can be considered too high – it can mean that our app’s growth could be even higher with increased spending or acquisition of new clients.
There is a lot of excellent mobile app analytics tools. We will definitely soon publish another article on app analytics tools on the blog. There is a couple of most popular options:
DeltaDNA founded in 2011, focused on the mobile game market. It enables you to learn about your users through accurate segmentation. The founders of the company describe themselves as gamers and data enthusiasts. With their tools, we can easily calculate all the indicators mentioned in this article and more – all in an easy to navigate, graphical form.
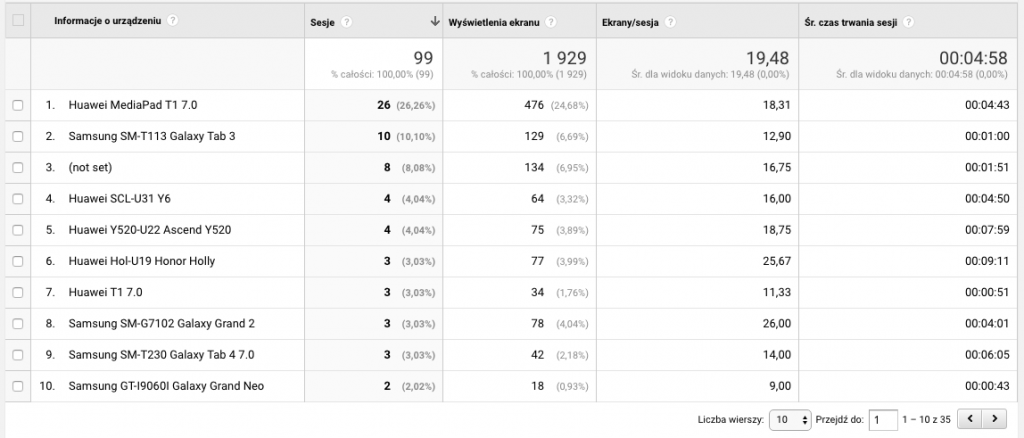
Google Analytics for mobile apps- this is one of the most popular app analytics tools of this type on the market, which should come as no surprise when you consider the fact that it has been developed by one of the biggest companies of the world. The fact that Google’s tools are free is definitely also a big attractor. Google Analytics is used by both small and big companies – the functionality of the tool is quite wide – it enables you to track the sources of user acquisition, the amount of installations and uninstallations, in-app behavior and the conversion/LTV indicators. The tool’s business functionality connected to planning and real-time tracking of the expected results also has great potential.
This is another example of a tool enabling in-depth analysis of mobile app user behavior. It is different from other solutions in that it is focused on functionality connected to marketing, such as A/B tests, marketing campaign tracking or personalized notification integration. Aside from that, it also allows for real-time tracking of user engagement, income and all of the previously mentioned indicators.
Another part of mobile app analytics are indicators connected to app performance. Some of the most important ones are presented below.
Network errors – they are most often connected to issues on the side of the internet supplier. Those types of errors can lead to instability in the app, it’s low performance or completely disable its functionality.
App latency – since not all user activity happens locally – some happens in the internet servers – a delay can form between the user’s command and its effect. We can then experience a so-called “lag”. Setting aside issues concerning the internet connection speed, which in itself is subject to latency, and the delays caused by the slow processing of the used device, you have to ensure the comfort of use of the app by optimizing the server’s process of sending and receiving data from the scattered systems.
Mobile app loading time – this indicator tells you about the weight of the app session on the system and the time it takes the app to conduct certain activities. This can be the boot-up time, the time it takes to toggle an option, or, in the case of games, the loading time of a level. Those elements should be monitored and optimized – the user mustn’t feel discouraged by the long reaction times of the app.
Mobile app crashes – this indicator tells you how often the app crashes throughout a given amount of session boot-ups. This indicator is very important before the market release. Even after extensive pre-release testing, it might happen that users will have difficulties you did not predict. Indicators connected to devices and operating systems are the solution – the amount of different devices on the market is huge. Thus, even with Apple systems, you will be dealing with a plethora of model configurations and operating system versions. While collecting this type of statistics, you should focus on the optimization of your app for the most frequently used configuration. For some of the above described indicators, there are multiple variables and even more variable definitions. Of course, there is also a lot of other data worth tracking in a mobile app. The presented information does not cover the whole topic – it only suggests an outline and the benefits of learning more about your product and its users. It is now said that good ideas are worthless – what matters is the finish. Even if we are confident that the solutions we offer our clients are exactly what they need, we should not rely purely on our intuition. This is why in every aspect where it is better to look at pure data than guess, it is also a good idea to collect it, analyze it and use it – for the benefit of both your business and its clients.

User retention in mobile apps and games
Mobile app analytics – the most important data indicators The mobile app market keeps...