Your game can become better: how to find problems and points of growth?
In this article Vasiliy Sabirov, Lead Analyst at devtodev, shares tips on how to make your game better by developing a proper algorithm for its analysis.
I like comparing analytics to medicine. Their approach to detecting problems (diagnostics) is pretty much the same:
In both cases, it is better to ask a specialist for advice than to self-medicate. A ‘physician’ for a game can be a producer, analyst, game designer. But don’t forget about people with a more narrow specialization (for example, level designers), they can be helpful in finding and eliminating specific problems.
In this article, I would like to share with you an algorithm of game analysis – from primary diagnostics to more detailed examination.
Level 1. Metrics of scale
Here we talk about basic indicators of the project:
Usually, these metrics are enough to compare the scale of different projects, to understand how big the project is and how its size changes over time.
These are metrics that investors look at first because their main interest is the revenue that the project can bring.
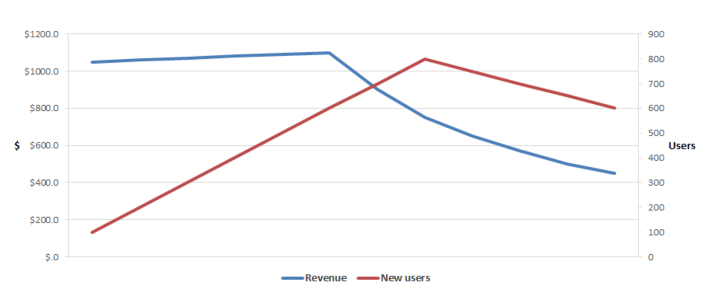
Some projects do not go beyond analyzing the metrics of scale. However, practice shows that this is not enough. To illustrate the importance of deeper analysis, here is an example. Imagine that constantly growing metrics of revenue and audience at some point start to decline (see the graph below). When you have only these two metrics of scale at hand, you are not able to figure out the reason behind the problem. For this purpose, you need quality metrics.
Level 2. Metrics of quality
Quality metrics are easy to distinguish from the metrics of scale: they are measured not in users and conventional units, but percents and conventional units per user.
Here we talk about the following metrics:
These metrics do not tell us about the scale of the project, but they tell a lot about how well it performs. If you have to decide which metrics to increase first, quality or quantity, I would recommend starting with quality. The app that functions well is more likely to find its audience.
These metrics are very helpful at detecting problems in the project (at least, they can show you where to search for a problem).
Here is a case to think about: your revenue started to decline – what’s wrong? Use a map of metrics to find out! Below you can find a very simple but quite universal version of the map of metrics. In fact, I would recommend to combine all metrics that you work within such a map and put arrows between metrics to show cause-effect relationship.
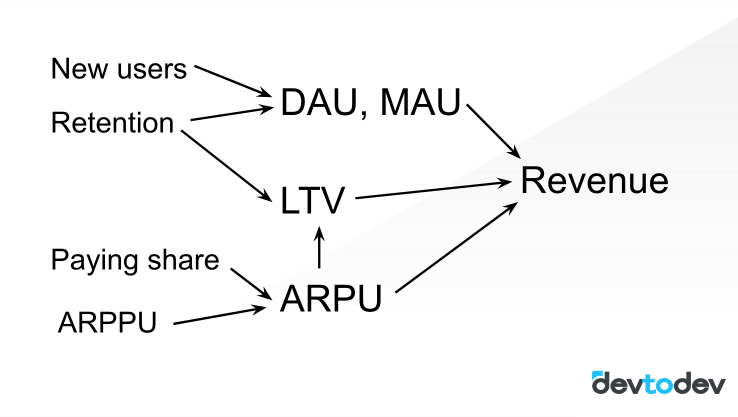
So, the revenue is declining. What to do?
Revenue is quantity multiplied by quality. In other words, your audience multiplied by ARPU. Therefore, first you should check, which metric is connected to the decline in revenue. Let’s say there are no big changes in audience, but ARPU started to decrease. ARPU is Paying share multiplied by revenue from a paying user (ARPPU). You notice that it is ARPPU that causes the decline. Now we have detected the place where the problem is located.
What can cause the decline of ARPPU? There can be different reasons. For example, it can happen when you reduce prices: you expect that this will increase the Paying share, but it turns out that only previously paying users to continue to pay and now they pay a smaller amount of money. Or the structure of paying audience has changed, and now only recent users pay.
Here we can talk about different hypotheses, but to understand the issue in more detail, we need to go a level deeper.
Level 3. Events and funnels
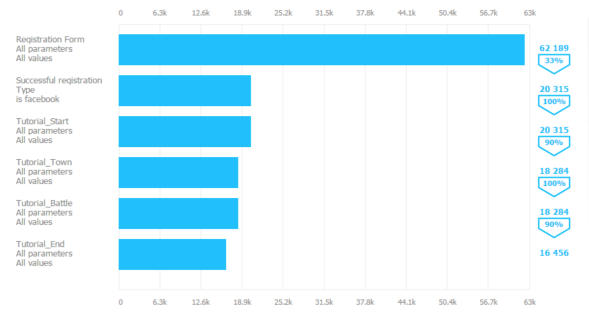
There is one more important metric, or to be more precise, a class of metrics. It is called conversion, which means the share of users who have completed a particular action (e.g., users who saw the game in the shop and who bought it / users who registered and completed the tutorial/users who made the first payment/users who completed the step B after the step A).
The detailed study of your projects’ conversion is very important to better understand user behavior and, as a consequence, optimize the product. Let’s say you see that users who registered with Facebook do not complete the tutorial – this is a sign to check if there are any technical problems (in our practice we had a similar case when there was a bug and users were not able to start playing). If you compare the conversion of opening a virtual good in the shop and of its purchase, you will find out which items require their description to be improved.
To be able to calculate conversion properly, when integrating the analytics system, you need to correctly choose events that you are going to send to it. Many developers track only two basic events: when users open an app and when they pay. It is enough to calculate metrics mentioned in the Level 1 and 2, but insufficient for more detailed analysis of user behavior. Therefore, we always recommend creating different custom events to be able to build conversion funnels and find bottlenecks.
Here are some tips that can help you:
Level 4. Game structure
Every mobile game is unique (with the exception of clones), and it is hard to find two games that have completely the same structure. Nevertheless, by analyzing the game structure of a big sample of games, you will inevitably notice some common features as well.
Here are the two entities that are common to all games:
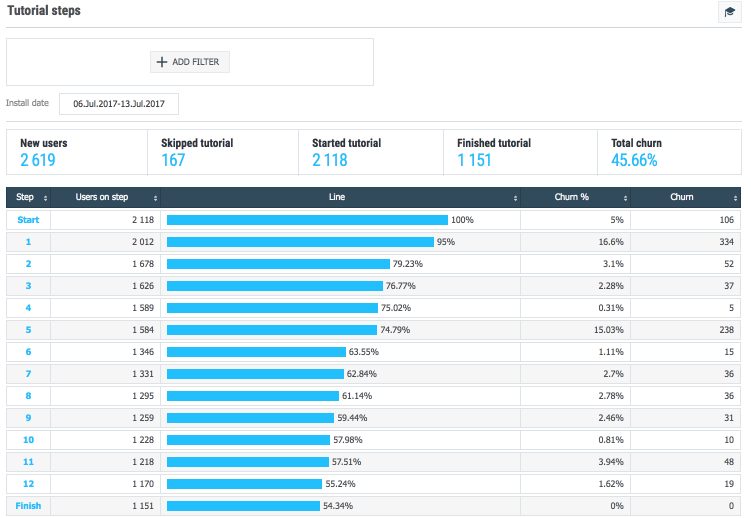
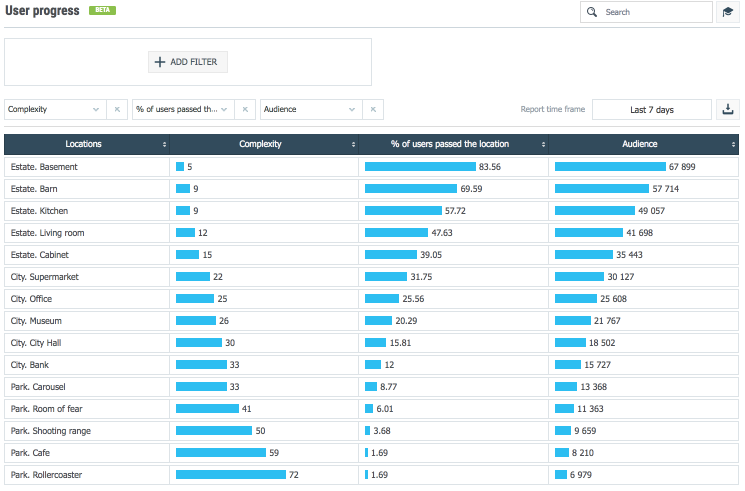
I recommend you to use these entities (levels and locations) when analyzing your game. Thus, you will be able to see the distribution of players among locations and levels, notice the churn rate on each of them.
Besides, it is very useful to track how different numeric parameters of the location (steps, health, boosters, etc.) change when you look at the successful or unsuccessful attempt.
Here is a case. When working on one game, we have noticed that players stuck on the 7th level. They do not leave the game but continue to play without moving on to the 8th level. What do you think could be the reason?
It turned out that players were simply afraid to move on to the next level. In this game, first 7 levels were introductory, levels starting from the 8th level were more advanced. Thus, players preferred to be the best among newbies rather than the worst players among “professionals”. Such a sharp change in the difficulty of the game was the mistake of the game design and of a matchmaking system too. So, game designers had to fix it, and it has improved the situation.
Level 5. Game economy
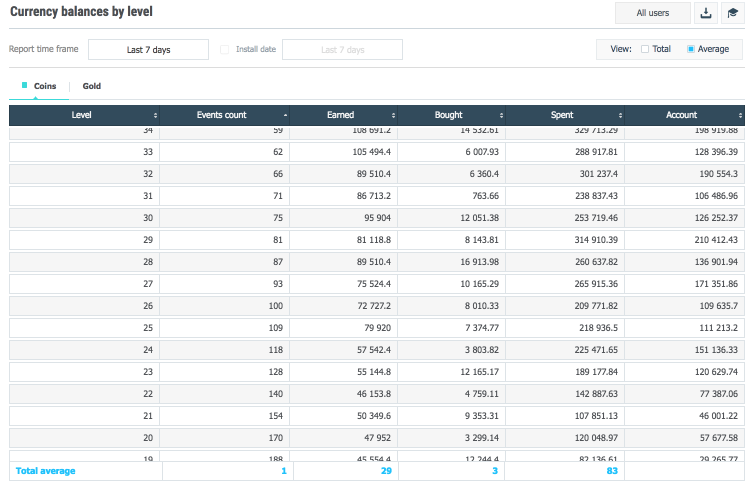
Players make purchases both for real money and virtual currency. Therefore, I recommend tracking the following indicators for each level or location:
1. Currency accumulated on players accounts
2. Average spendings
3. Average earnings
4. An average amount of bought currency
5. Most popular items
When you analyze these things, you are able to notice an imbalance in the game economy (usually it comes out in a form of sharp difference in values). After detecting the problem, you need to improve it by changing the parameters of purchases (say, change the price of a chest). Promotion campaigns with discounts can also be a very effective tool: if you see that too much currency is accumulated on the level X, and players on this level prefer to buy the item Y, you can give a discount for this item on this level.
A few more tips
So, this is how the algorithm of game analysis includes:
1. Key indicators of the project
2. Quality indicators
3. Events and funnels
4. Game structure
5. Game economy
But that’s not all. Here is one more way to generate ideas on how to make your game better. It is called segmentation.
If you make conclusions not for the whole audience, but for some specific segments, you increase the number and quality of hypotheses that you can come up with. Here are some examples of segments that can help you:
Besides that, you can segment users by country, language, device, event completion, traffic source – the limit is only your imagination and common sense.
It is important to remember that analytics for sake of analytics is a wrong way to go. The aim of analytics is to make right strategic decisions. The algorithm that is described in this article will help you to find the problems in the game and points of growth so that you can make informed decisions. Wish you good luck in making your game even better!

Best mobile advertising networks according to AppsFlyer
In this article Vasiliy Sabirov, Lead Analyst at devtodev, shares tips on how to make...