Fast metrics: how to detect problems in a Soft Launch stage
Soft launch stage and in-app analytics
When providing analytics consulting for mobile app developers who have a game on a soft launch, I often hear the following: “No time to explain, let’s just buy more traffic”.
After the game or its new version is launched, it is extremely important to track right metrics. However, practice shows that quite often developers look at wrong metrics or expect unusually high values, and, as a consequence, make wrong decisions.
In this article Vasiliy Sabirov, lead analyst at devtodev, will share with you fast metrics – indicators, which can be analysed during the first day(s) after the game has been launched.
First day metrics
Perhaps the most important and the most popular metric at this stage is Day 1 Retention. You can find it in any analytics system on the market. The metric shows the share of users that return one day after install. As long as this metric demonstrates the players’ first impression from the game, to increase its value you need to pay attention to the first session and visual style of the project in general. Actually, there are a lot of materials devoted to Day 1 Retention, so I suggest to move forward and look at less explored, but still very useful, metrics.
Have you ever worked with Day 0 Retention? Do not be surprised, it shouldn’t be necessarily 100%. This metric shows the fraction of players who returned within 24h after install. It is calculated even faster than Day 1 Retention, and, therefore, is very useful during the soft launch, when you need to quickly understand the situation. As a rule, in successful projects Day 0 Retention is equal to 60-70%.
Many mobile games have a tutorial, and there are several interesting metrics that can be used to analyze it. For example, Tutorial Retention. No matter how many minutes / hours / days players have spent to complete the tutorial, the important question is whether they return or not. This metric shows how many players have made a decision: ‘Ok, I have completed the tutorial and understand what the game is about – now I want to see how it is to play it in real’.
I can’t give you exact benchmarks for this metric, because its value highly depends on the genre of the game. However, this metric suits perfectly well for studying the efficiency of new game versions, especially in case you make some changes to the tutorial. Ideally, its value should grow from version to version.
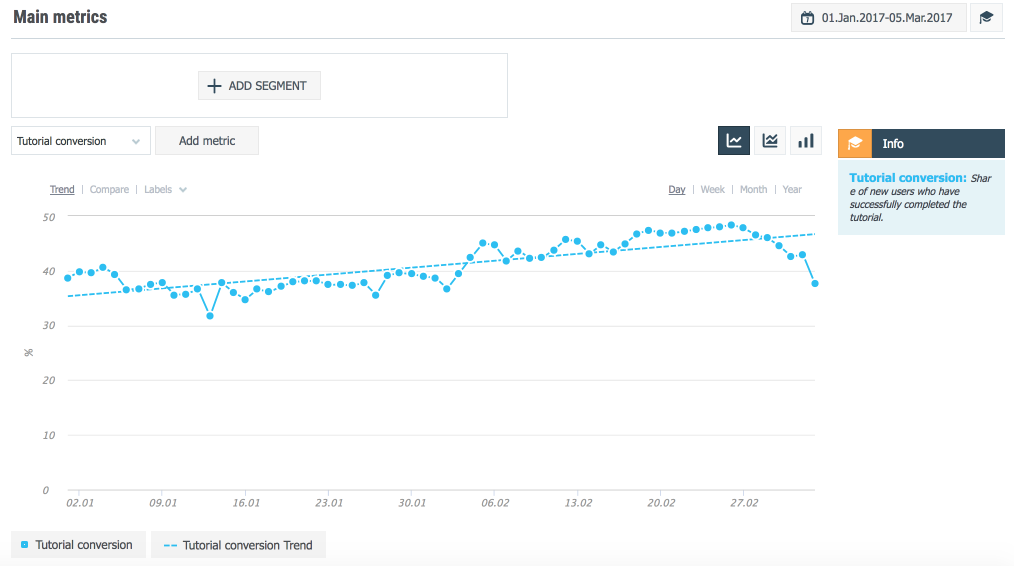
One more important metric is Tutorial Conversion – the share of players who have completed the tutorial. This metric helps to see the complexity of your tutorial and how clear and understandable it is for players. Usually, developers expect this metric to be around 70-80%, but again, it strongly depends on the genre and complexity of the game.
Pay attention to players who skipped the tutorial, or Skip Rate (you have a ‘Skip’ button in your tutorial, don’t you?). The high value of this metric is not always a bad sign. In my practice there were cases when serious changes in the game returned many experienced players and, obviously, these players didn’t want to start the tutorial anew.
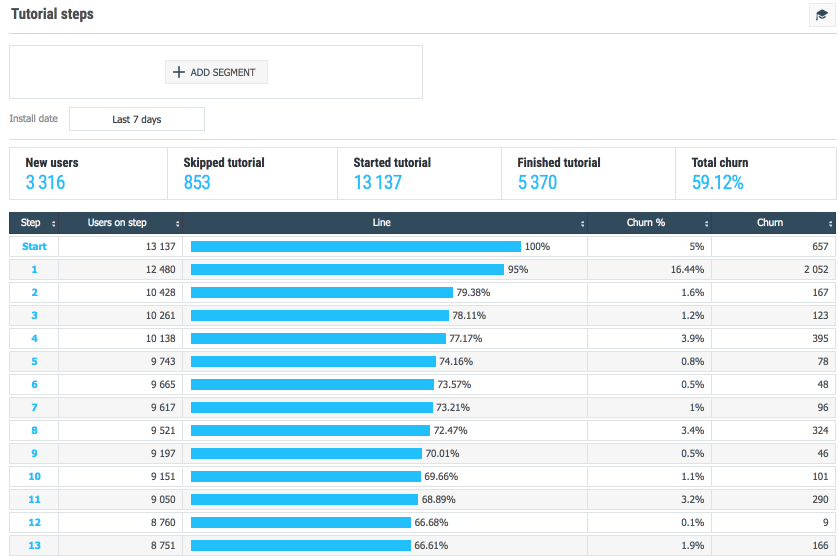
So, players can 1) skip the tutorial, 2) complete the tutorial, 3) start the tutorial, but not complete it. To study this last category of players, I recommend to build a conversion funnel by tutorial steps, which allows to see at which steps many users churn.
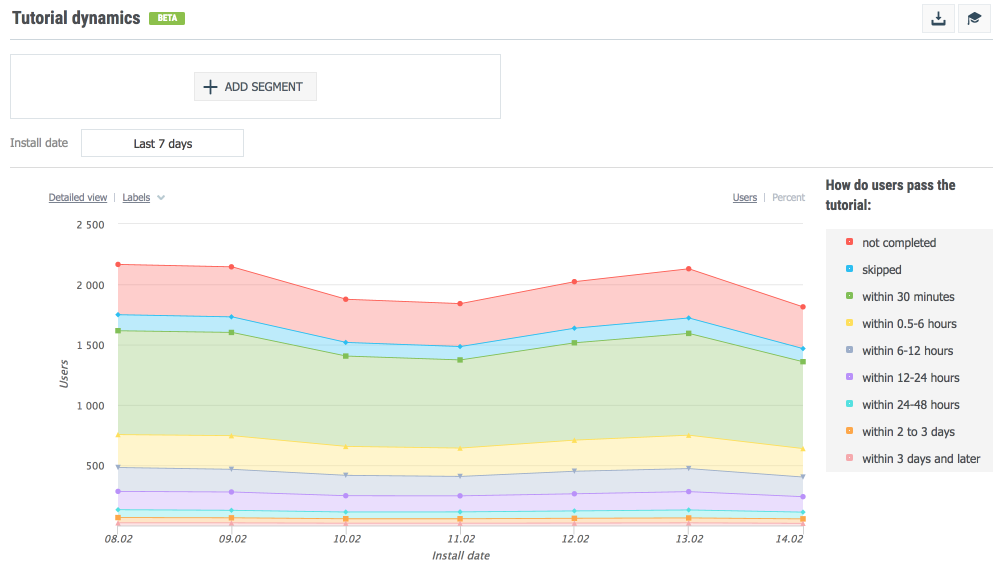
The last metric for tutorial analysis that I want to share with you is the speed of tutorial completion. It is important to remember that there are always players who spend much more time on tutorial than you expect – a week, two weeks, or even a month. Such players will considerably increase this metric if we take the average value. Therefore, I recommend to work with median in this case.
It would be wrong to assume that the less time it takes for a player to complete the tutorial – the better. However this metric can be very useful when analysing its dynamics: how it changes from version to version. Thus, you will see how players react to changes in the tutorial. It would be even better, if you analyze the speed of tutorial completion together with the tutorial conversion.
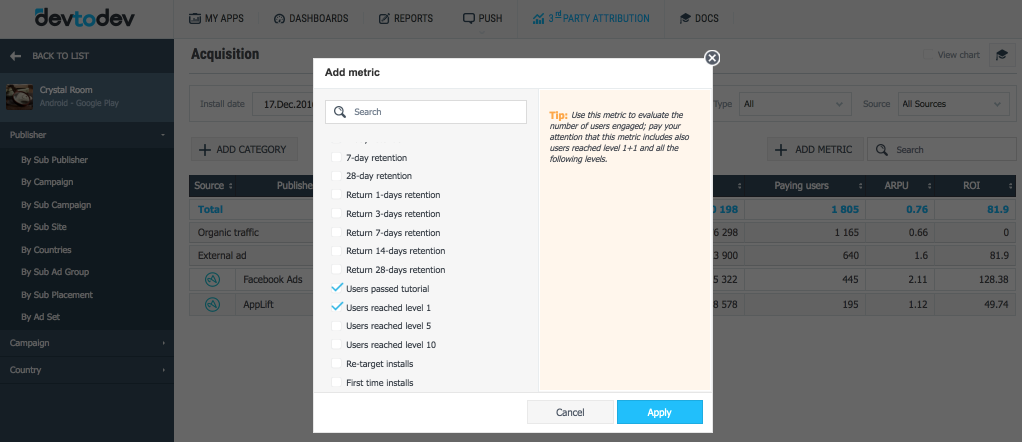
After completing the tutorial, players start the game. At this stage it becomes quite difficult to talk about universal metrics of user behavior. However many games are based on levels (these can be levels of players and levels of the game), so it makes sense to work with the share of users who have reached level N. This is a useful metric, which allows to track user behavior in the beginning of the game. Later it will be possible to build graphs that show conversion by levels. Such conversion funnels allow to find bottlenecks (places where many users quit the game) and increase retention by improving the gameplay or sending targeted bonuses/offers/hints.
First week metrics
All of the above metrics can help you to track user behavior already on the first day after the game (or its new version) release. However some metrics require a bit more time to be calculated. For the most part these are monetization metrics.
Many developers start using basic ARPU (ARPDAU – Average Revenue Per Daily Active User) at this stage. I consider it to be a mistake, and here is why. ARPU (Average Revenue Per User) is calculated as revenue divided by audience, but in the beginning the structure of audience changes significantly. For example, one day you buy traffic and 80% of your audience are new users. After a week, the situation may change, and the audience will consist of quite experienced players. ARPDAU in both cases is calculated with the same formula, but will show different values.
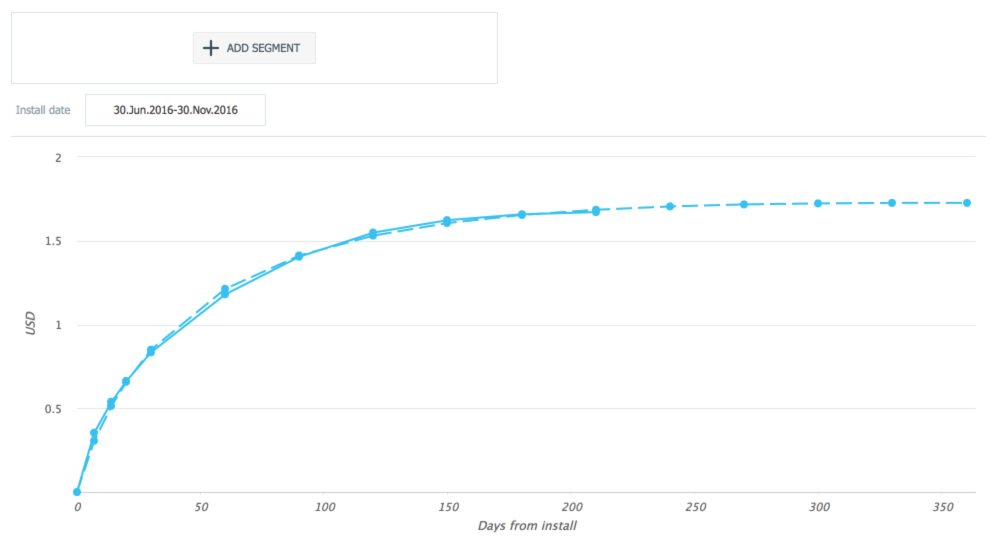
Therefore, I recommend to use the Cumulative ARPU for N days. It shows how much money one average user brings to the project during their first N days in the project.
As a rule, this metric changes along a logarithmic curve: it grows quickly in the beginning, but then the growth slows down. This metric works great for measuring monetization changes in the game, because it shows the quality of the audience, its monetization potential.
By the way, when N is headed towards infinity, this metric will turn into LTV.
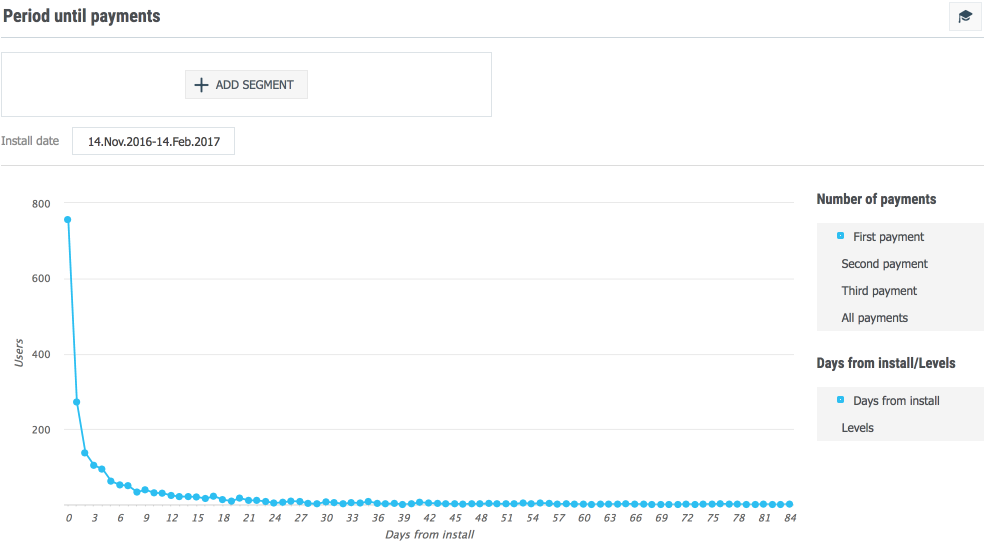
One more metric that indicates the monetization potential of audience is the First Payment Conversion. It can be calculated based on data from the first week and shows how willing your players are to pay. Ideally, the share of such users should grow from version to version.
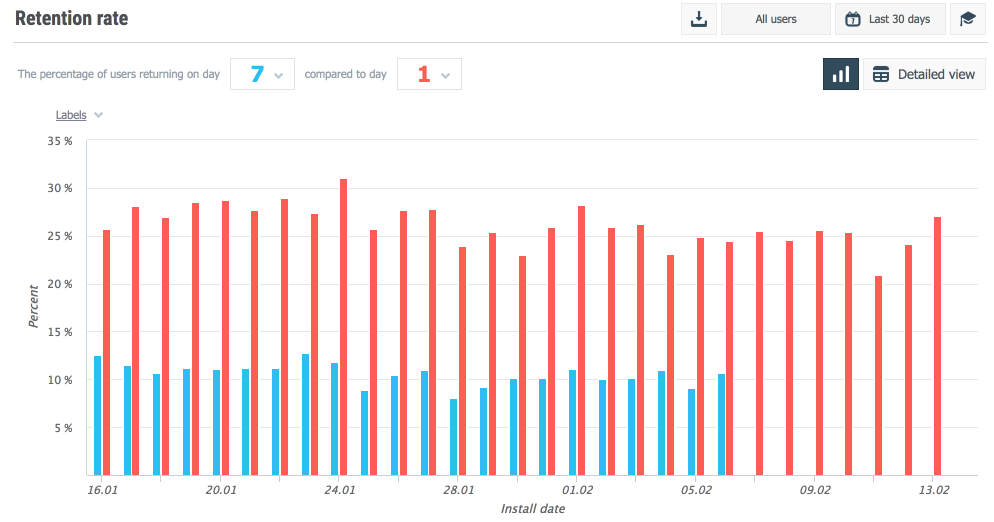
Also, don’t forget about Day 7 Retention – the share of players who returned on the 7th day after the install. Usually these are players who have already completed the tutorial and started the game. In the magic formula ‘40-20-10’ Day 7 Retention can be found in the middle, which means that 20% is a good value for this metric.
Finally, let’s get back to where we started. We’ve bought traffic for a game on a soft launch. The success of the game highly depends on its virality (how many players share it with their friends). After a week, you can try to calculate the K-Factor (the indicator of virality), by comparing the number of paid and free players for the period. The bigger period you take, the more correct results are. That is why a week is a minimum period when you can start to calculate it.
Let’s say you have bought 500 installs during the first week, and 300 players have come from organic channels. Perfect! You have 0.6 of organic install per one paid install.
Later on, when calculating K-Factor for a month and more, I would recommend to take the number of organic installs and divide it by the audience for the previous period (not the number of paid installs).
Say, in January your monthly active audience (MAU) was 1000 players. In February you acquired 400 new players. In this case K-Factor is 0.4, i.e. it is possible to say that each player that was active in January brought
All of the above can be used for measuring the quality of game in its early stages, on a soft launch, or when a new version is released. However, you are always free to add your own metrics to this list, because nobody knows your game better than you.

In-App Purchases – Mobile game monetization strategy
Soft launch stage and in-app analytics When providing analytics consulting for mobile...