How to determine an advertising budget for a hyper-casual game? Google Spreadsheet Prediction Model
As you probably know, hyper-casual was one of the biggest mobile trends in 2019, and there are still a lot of newcomers in the hyper-casual space globally as evidenced by store rankings so far this year. Advertising remains one of the keys factors in scaling the user base and increasing revenue in the mobile space, and the hyper-casual market is no exception. When a hyper-casual developer is confident in the quality of their game (thanks to retention tests) and its potential to make money (thanks measurement of LTV), it’s time to start advertising. The question is, how do you determine an ad budget while remaining profitable?
This process can be overwhelming, but don’t panic: we’re here to help. The best part? You don’t need a team of data scientists to do this; all you need is Google Spreadsheet. You can follow all of the calculations below in this spreadsheet. Once you’re are ready to try this model on our data, you can just copy the spreadsheet and change the numbers according to your needs and KPIs.
Note: The numbers in this model are not based on actual data or meant to be taken at face value. These numbers serve as examples intended to show how to use this model and make a business case for objective data.
Collecting the data
The first step is to collect all of the required KPI for our simulation. Typically, with hyper-casual apps, the revenue comes mostly from advertisements; therefore, there are no in-app purchases in this model.
Monthly ad spend
The sum you are willing to spend on advertising. This is the core metric of our simulation. The end goal is to find the number that will give us the most profit.
Daily organic installs
Regardless of ad spend, we assume that we will receive a certain number of organic installs.
The percentage of organic installs that comes from paid installs
This is the most complicated and debatable variable. When you run user acquisition campaigns, your app will grow in the store ranking, which brings you more organic installs. We assigned the ratio below based on a common rule of thumb.
- 25% – if Monthly Ad Spend ≤ $10,000
- 50% – if Monthly Ad Spend ≤ $50,000
- 75% – if Monthly Ad Spend ≤ $100,000
- 100% – if Monthly Ad Spend ≤ $200,000
- 125% – if Monthly Ad Spend ≤ $500,000
- 150% – if Monthly Ad Spend ≤ $1,000,000
So for example, if we are planning to spend $50,000 on ads in a month, we should expect a 50% growth for organic users. If you have other numbers in mind, just change it in the formula of the spreadsheet.
CPI
You’ll need your average CPI number here. Cost Per Install can be tricky, as you will work across different countries and ad networks. We used $0.3 based on the results of our CPI Hyper-Casual Benchmark Report.
eCPM
Cost per 1,000 ad impressions within your app. Just like with CPI, your goal is to find the average. This depends on what ad networks and ad formats you use within your app. For this example, we will use $5.
The number of impressions per day per DAU
How many ad views one user generates per day. It’s up to you to decide how often to show ads to users, and you also control how long they will stay in your app. Here we assumed it will be 10 impressions per day.
Retention rate
For the retention rate, let’s imagine that we have an app with the following stats:
- Day 1 retention rate (D1R) – 40%
- Day 7 retention (D7R) – 10%
- Day 14 retention (D14R) – 8%
- Day 30 retention (D30R) – 5%
- Day 60 retention (D60R) – 1%
We assume that retention decreases linearly between 1,7,30, and 60 days. Therefore, we can say what retention we will have on any given day of the period.
Here is the example of how we calculate that for the period between Day 1 and Day 7 retention.
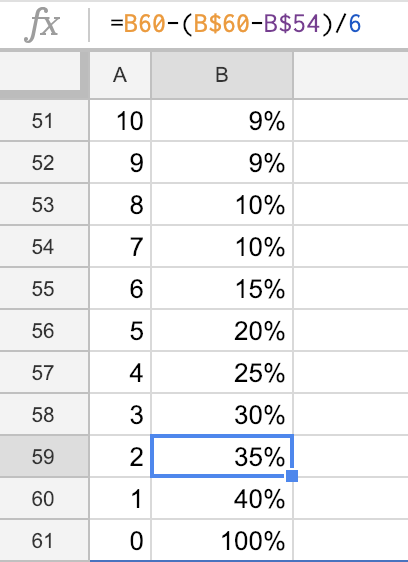
The six in the formula above stands for the number of days between each of the points.
Note: retention calculation is in the hidden rows of the spreadsheet. You will need to make a copy of the spreadsheet before you can see it and make your own changes.
Doing some math
The next step is to calculate some metrics that will help us determine at what scale of advertising our hyper-casual app becomes profitable
Monthly paid installs
Ad spend divided by cost per install (CPI).
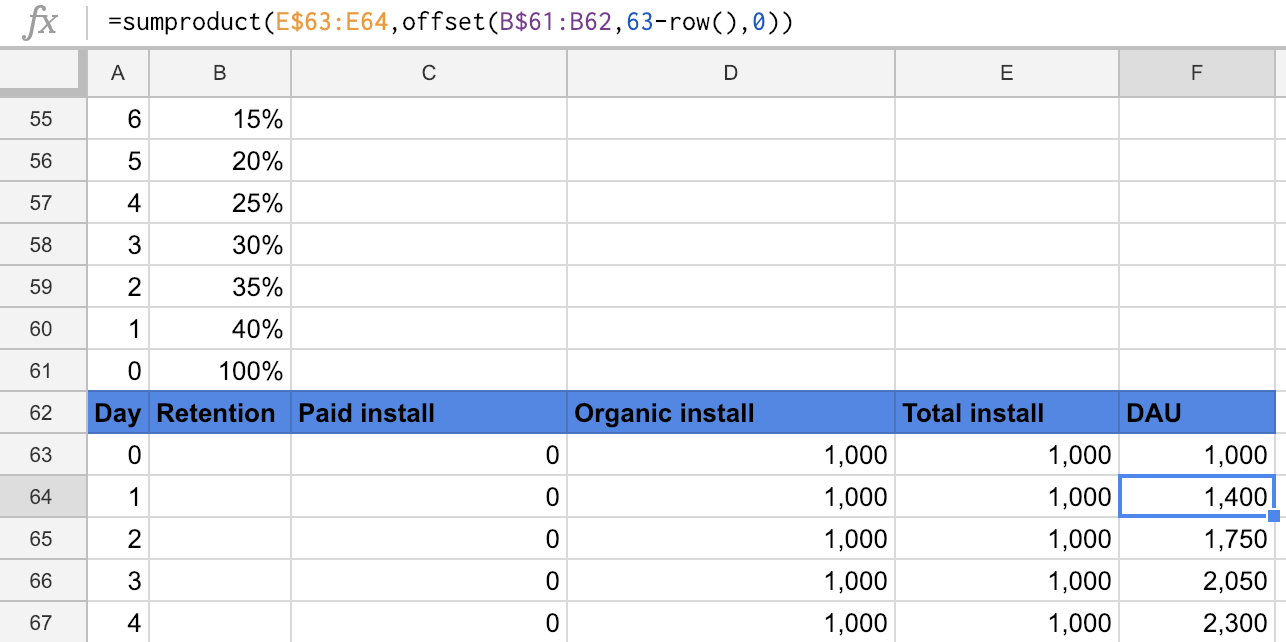
Average DAU
New installs for the day plus retained users from the previous day.
Using our retention numbers and the number of paid and organic installs we can calculate the average DAU. Refer to the spreadsheet for more details and formulas.
Monthly revenue
(Average DAU * # of impressions per day per DAU * eCPM * 30) / 1000
We use 30 for the number of days in a month. Divide the total by 1000 as eCPM is calculated for 1000 impressions.
Each DAU will see a set number of ad impressions, and for each of these ad impressions, we will receive revenue.
Monthly profit
Monthly revenue minus monthly ad spend
Margin
Monthly profit divided by ad spend
After we put all the formulas and variables into a spreadsheet, we got the following results.
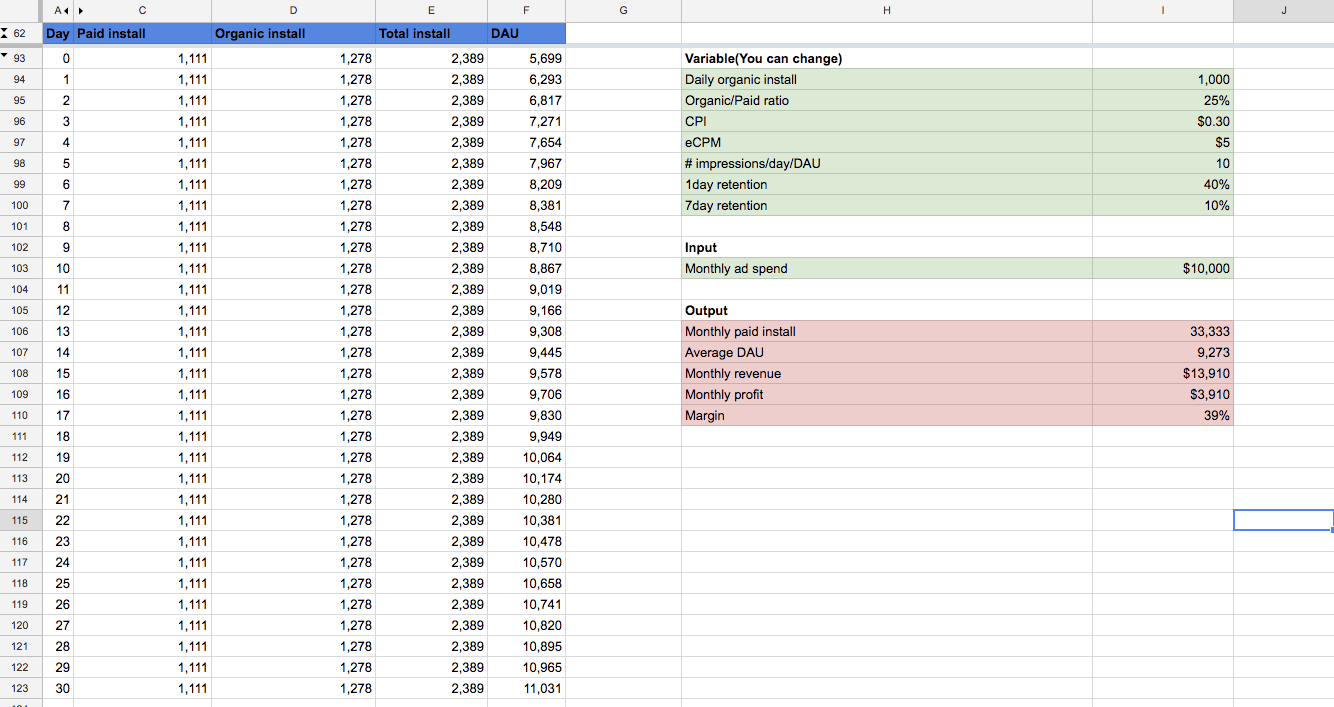
Now we can change the monthly ad spend and the output will show the result for each simulation. In order to do the comparison, we want to record these numbers in a different tab of the spreadsheet.
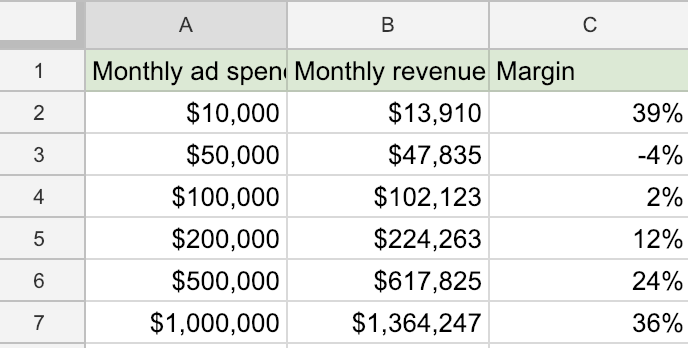
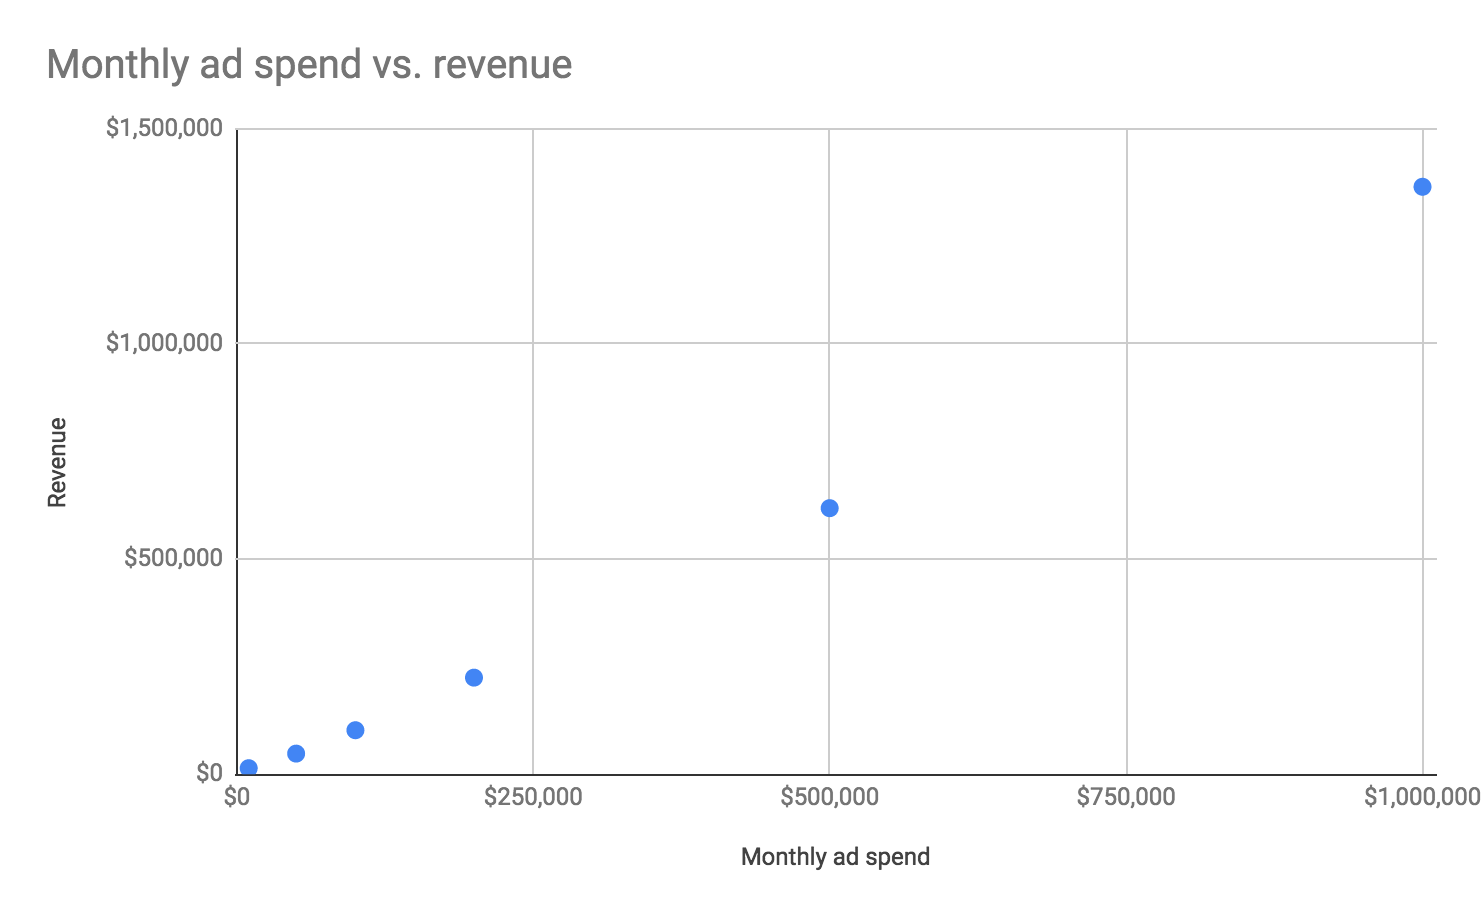
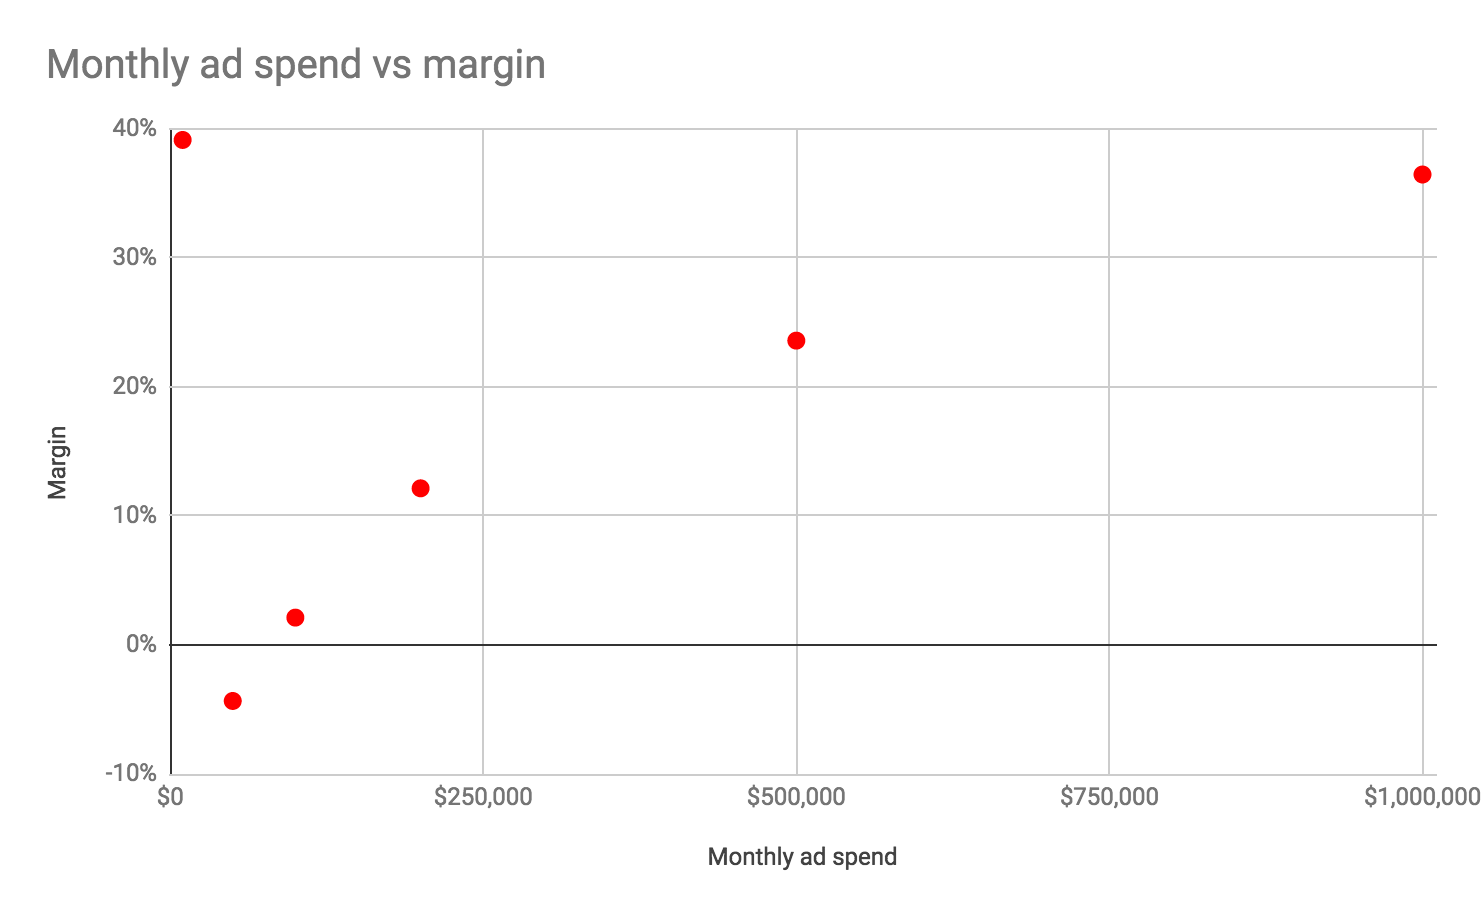
Moreover, in order to visualize the results we can build two types of graphs:
- Monthly ad spend vs. monthly revenue
- Monthly ad spend vs. monthly margin
Conclusion
As you can see in our example simulation, the margin increases drastically as the monthly ad spend goes up. Again, this simulation is not based on numbers from a real app and just used for example purposes. We encourage you to fetch all of the KPIs from your analytics to get the most out of this method.
The only factor that will remain unknown until you run UA at scale is the percentage of organic installs that comes from advertising installs. If you are considering user acquisition to help get your app to the top of app store rankings, you will probably need a certain amount of ad spend. This will always involve risk, but it’s better to make a decision based on statistics, not just intuition.
Also, eCPM, # of impressions per day per DAU, retention, and other metrics differ for each app. You’ll get different results if you make changes to these variables, so it is also possible that when you obtain the target app KPIs, you will achieve desired margins.
Do you have suggestions or comments about our model? Feel free to send email to support@tenjin.io and let us know!
This guest post is written by Tenjin’s Head of Sales, APAC – Makoto Taguchi.

Idle Clickers – How much fun clicking can be?
As you probably know, hyper-casual was one of the biggest mobile trends in 2019, and...