Key insights from RevenueCat’s State of Subscription Apps 2026
Never in history has building a subscription-based mobile app been so easy. And never in history has it been so hard to make money from one.
In recent years, artificial intelligence has completely transformed the economics of building products. Thanks to AI and new developer tools, a single founder can now build an MVP over a weekend — something that not long ago required a team, a budget, and months of work.
The result? The App Store and Google Play have been flooded with new apps.
According to the State of Subscription Apps 2026 report, the number of new subscription apps grew from around 2,000 per month in 2022 to nearly 15,000 per month at the beginning of 2026. That’s more than a sevenfold increase in just four years.
At first glance, this sounds like a golden age for app creators. If building a product has become easier than ever, logic would suggest that building a business should also be easier.
But this is where the most interesting part of the story begins. Because most of these apps will never make serious money.
The RevenueCat report, based on data from 115,000 apps and over $16 billion in revenue, clearly shows that the subscription app market has entered a new phase: an enormous supply of products combined with increasing concentration of results.
Key numbers from the report
The market at a glance
- 115,000 apps analyzed in the report
- $16B+ in generated revenue
- 1B+ transactions
- ~15,000 new subscription apps launched monthly in 2026
- 69% of market revenue is generated by apps launched before 2020
- Only 4.6% of apps reach $10,000 MRR within the first 2 years
Strongest insights
- The top 10% of apps grow 300%+ per year
- The top 25% of apps grow 80%+ year over year
- The bottom 25% of the market loses around 33% of revenue
- AI apps have +41% higher revenue per paying user
- At the same time, AI apps have +30% higher churn
- A hard paywall converts about 5× better than freemium
- Trials longer than 17 days convert about 70% better than short trials
- 31% of cancellations on Google Play result from billing issues
- 41% of top apps generate revenue through the web
Subscription App Market Benchmarks (2026)
| Metric | Median | Top 10% |
|---|---|---|
| MRR Growth (YoY) | 5.3% | >306% |
| RLTV per Paying User (Year 1) | 23 USD | >74 USD |
| Download-to-Paid Conversion (D35) | 2.0% | >9.1% |
| RPI after 60 days | 0,34 USD | >2.28 USD |
| Time to $1,000 MRR | 58 days | — |
| Chance of reaching $10k MRR | 4.6% of apps | — |
The App Market Is Starting to Behave Like Venture Capital
One of the most striking conclusions from the report is the huge inequality in outcomes between apps.
At the median level, the market looks relatively stable. Median year-over-year MRR growth is 5.3%, which might suggest that the situation is fairly predictable. But the real picture only appears when we look at the distribution of results.
What does the growth distribution look like?
| Market Segment | Growth Dynamics |
|---|---|
| Top 10% of apps | >300% per year |
| Top 25% of apps | >80% year over year |
| Market median | 5.3% |
| Bottom 25% of apps | -33% |
This closely resembles venture capital dynamics. Most projects deliver average or weak results, but a small group of products grows extremely fast and captures a disproportionate share of the market.
Conclusion: the average product is becoming less attractive as a business. It’s no longer enough to “do reasonably well.” You need to find a way to break into the top percentiles of the market.
AI Lowered the Barrier to Entry — But Raised the Level of Competition
For years, the biggest barrier to building apps was technology. You had to hire developers, set up a backend, build an interface, maintain infrastructure, and go through the entire complex process of delivering a product.
Today, a large part of this can be done faster, cheaper, and with smaller teams.
What AI changed?
- code generation
- faster prototyping
- UI creation
- automation of parts of the development process
- faster product iteration
This lowers the cost of building an app, but at the same time it triggers another force: a rapid increase in supply.
Explosion in the Number of New Apps
| Year | Number of New Subscription Apps per Month |
|---|---|
| 2022 | ~2 000 |
| 2026 | ~14,700–15,000 |
Conclusion: the barrier to entry has dropped, but more people have started playing the same game. Competition is growing faster than demand.
New apps are flooding the market, but older ones still capture the money
One of the most surprising conclusions from the report is that although the number of new apps is growing at a record pace, most of the revenue is still generated by older products.
Revenue structure by app cohorts
| App cohort | Share of market revenue |
|---|---|
| Launched before 2020 | 69% |
| Launched in 2025–2026 | 3% |
This shows how powerful the scale effect remains in the app ecosystem.
Why older apps win?
- they have a larger user base
- they are better optimized
- they have a stronger position in the App Store and Google Play
- they have larger marketing budgets
- they have had time to improve onboarding, pricing and retention
Conclusion: entering the market today is easy. Building a durable advantage is not.
Geography still makes a difference
Although apps can be global from day one, the report shows that the location of the team and users still matters.
RLTV after 1 year by region
| Region | RLTV per paying user (Realized lifetime value per payer) |
|---|---|
| North America | 32 USD |
| Global median | 23 USD |
| Western Europe | 25 USD |
| IN/SEA | 14 USD |
Regional medians of growth and conversion
| Region | Median MRR growth (YoY) | Median D35 conversion |
|---|---|---|
| North America | 1.6% | 2.6% |
| Western Europe | 12.1% | 2.0% |
| Latin America | 17.2% | 1.5% |
| Asia–Pacific | 12.3% | 1.7% |
| MEA | -9.7% | 1.9% |
Conclusion: the economics of apps still depend on purchasing power, user maturity, and the willingness to pay for software in a given market.
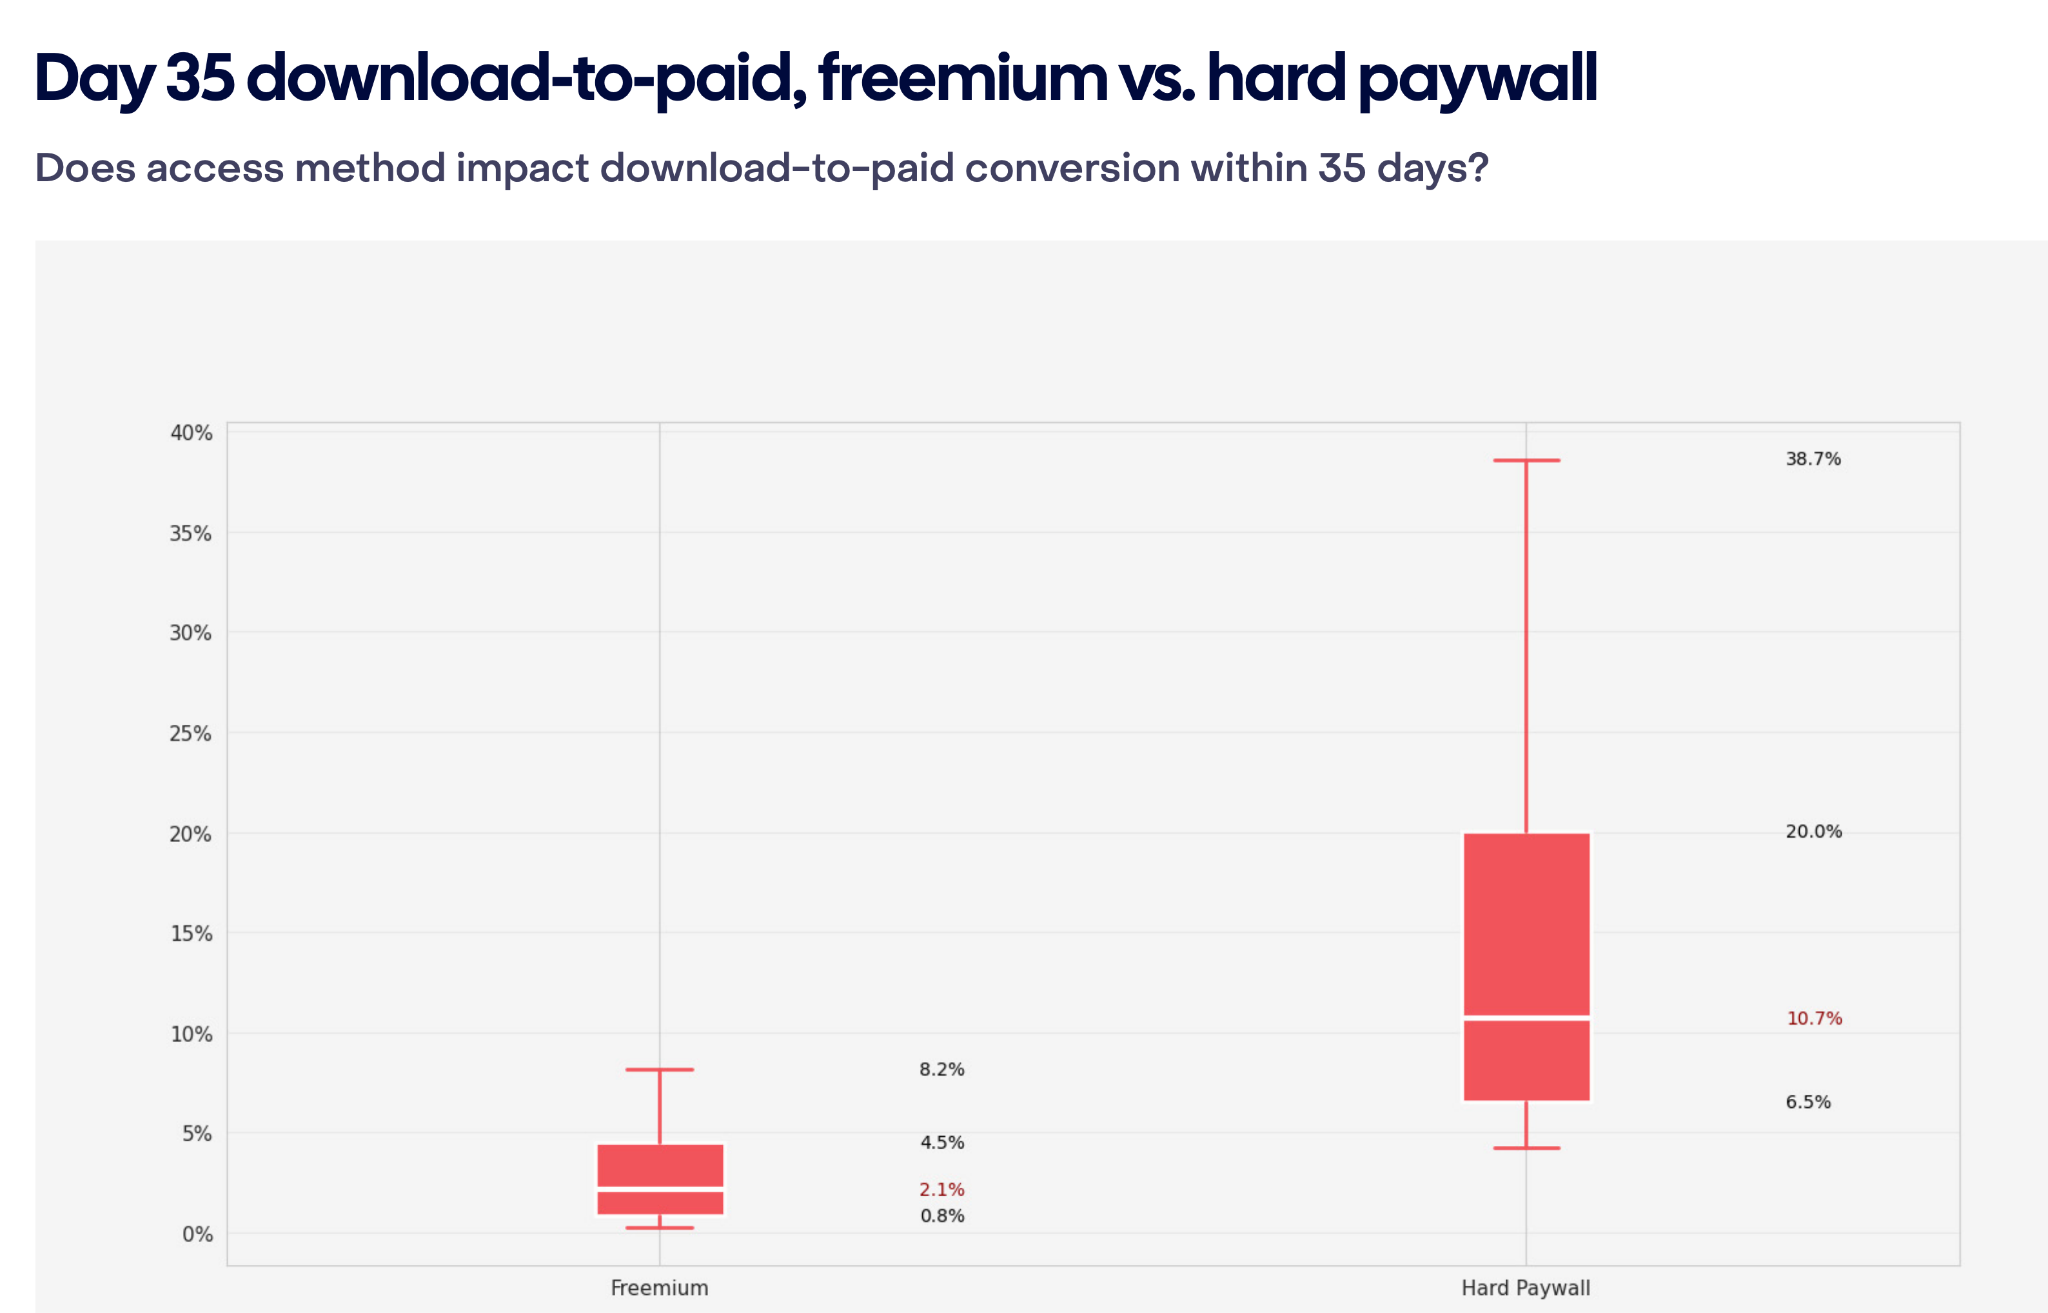
Hard paywalls crush freemium at the start
One of the oldest debates in the app world is whether an app should be freemium or paid from the beginning.
At the top of the funnel, the data is very clear.
Hard paywall vs freemium
| Metric | Hard paywall | Freemium |
|---|---|---|
| Conversion | 10.7% | 2.1% |
| RPI after 14 days | $2.32 | $0.27 |
| RPI after 60 days | $3.09 | $0.38 |
This means:
- about 5× higher conversion
- about 8–9× higher revenue per install at the beginning of the lifecycle.
State of Subscription Apps 2026 by RevenueCat
But there is an important nuance: in the long term, differences in retention largely flatten out. A hard paywall is a great strategy for fast monetization, but it does not necessarily automatically create a better product.
The real battle for the user happens in the first session
If there were one product lesson to take from the entire report, it would be this: a user’s fate is decided very early.
Key data about Day 0
- 55% of cancellations of 3-day trials happen on the day the trial starts
- about one-third of all conversions to a paid subscription happen on the day of installation
- in the freemium model, 23% of conversions happen only after 6 weeks or later
This shows that the first minutes of the user experience matter enormously.
What do the best teams do?
- obsessively optimize onboarding
- shorten the path to the “aha moment”
- set up the paywall more effectively
- personalize the first user experience
AI sells well, but retains poorly
One of the most interesting conclusions from the report is the paradox of AI apps
AI apps vs the rest of the market
| Metric | AI apps |
|---|---|
| Revenue per paying user | +41% |
| Churn | +30% |
This suggests that the hype around AI is very effective at driving the first purchase, but it is much harder to turn that into a lasting relationship with the user.
What may be behind this paradox?
- some users buy out of curiosity
- AI hype drives the initial sale
- many products still do not build lasting value
- the product does not become part of the user’s daily workflow
Conclusion: for AI founders, monetization is not the biggest problem today. Retention is.
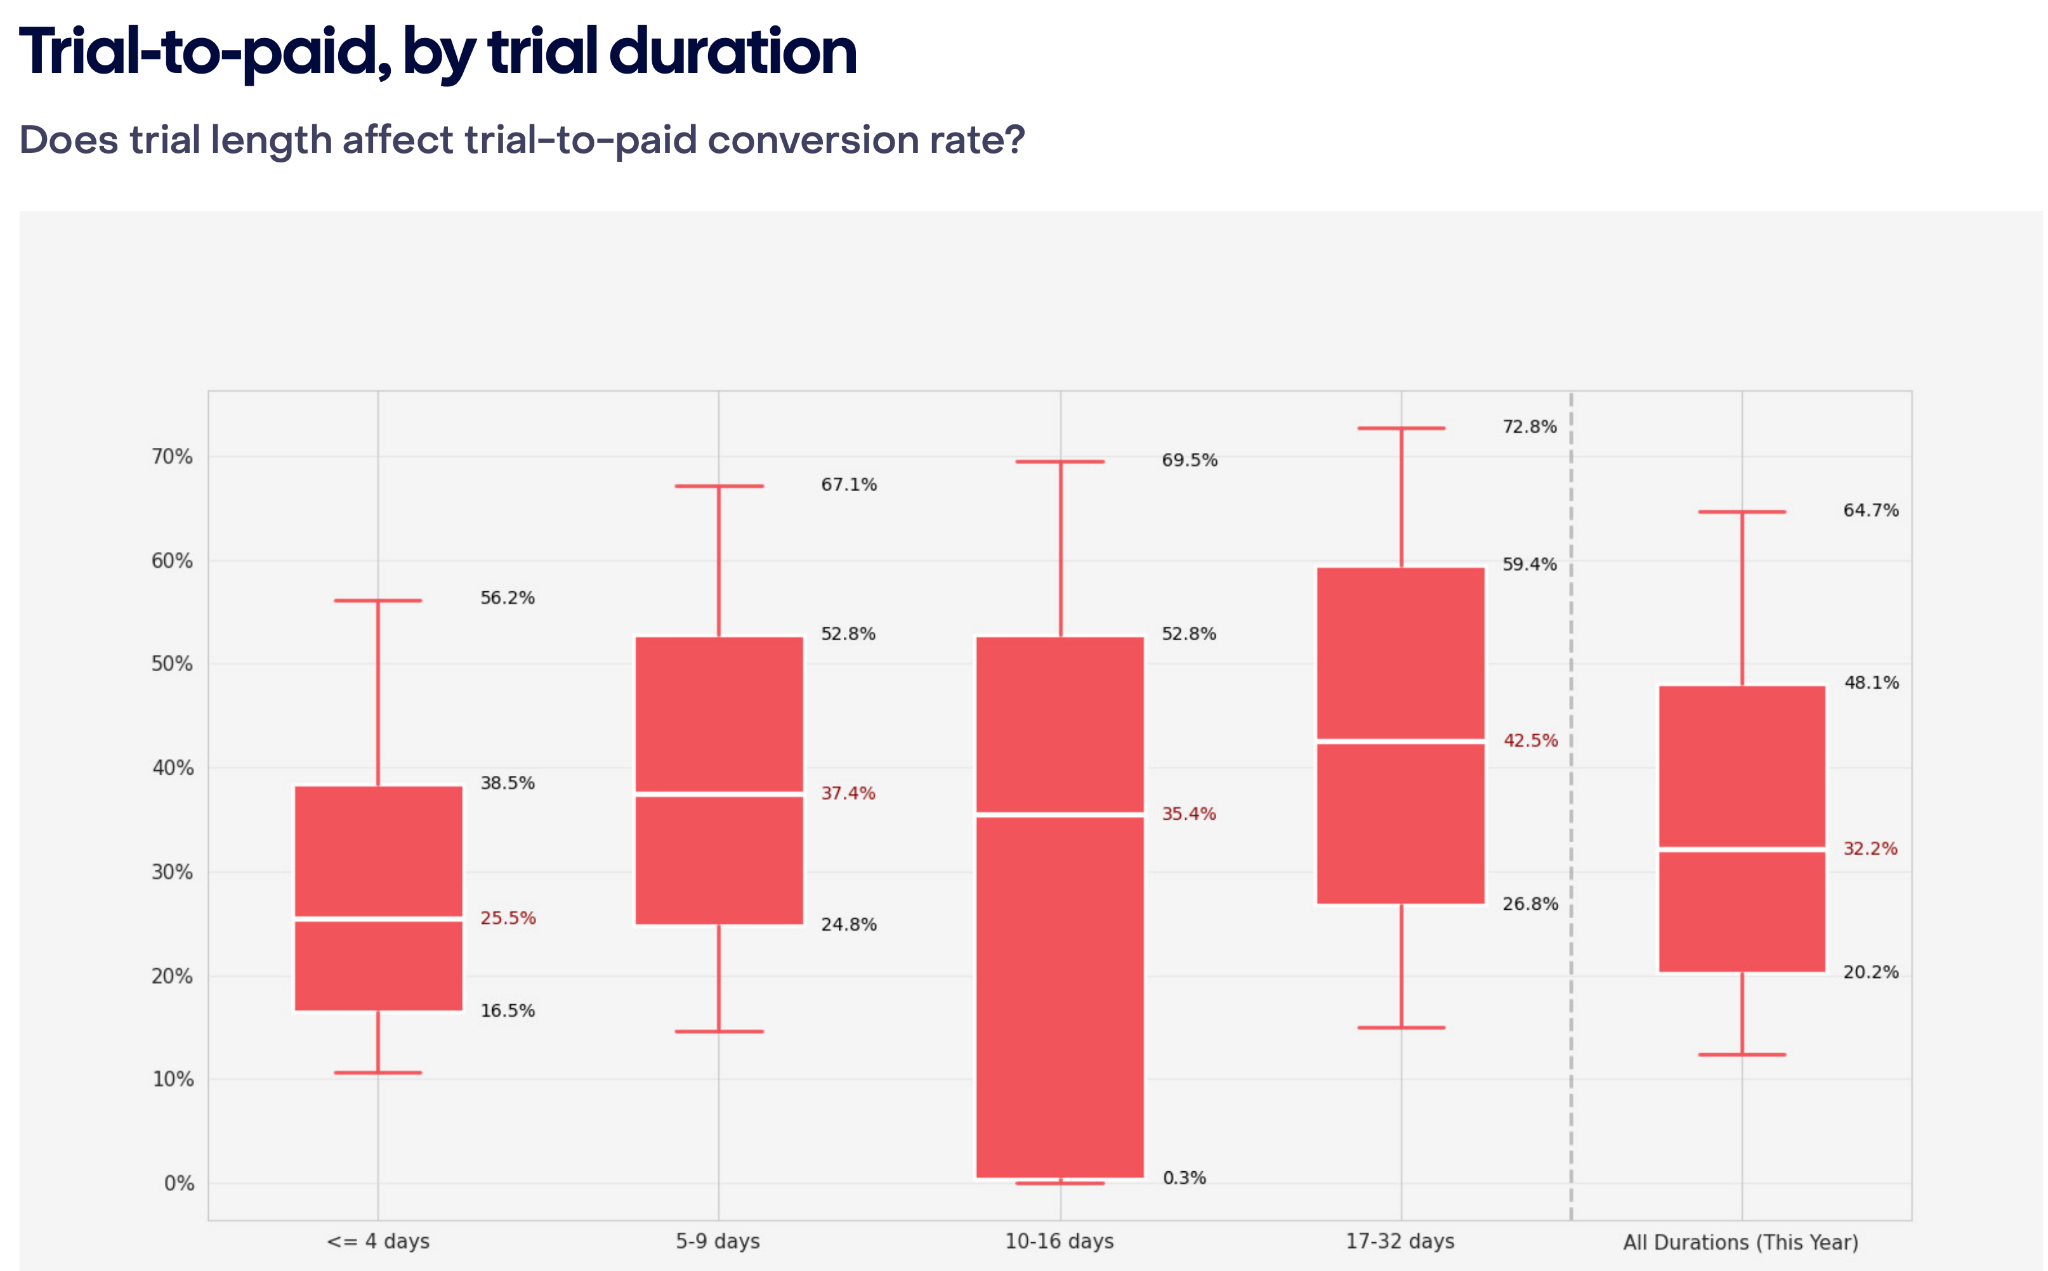
The market is shortening trials even though the data suggests otherwise
The data shows that longer trials perform clearly better than short ones..
Trial length vs conversion
| Trial type | Conversion |
|---|---|
| 17+ days | 42.5% |
| Short trials | 25.5% |
That is a difference of about 70%.
Despite this, more and more apps are shortening trials to 3 days or even less.
State of Subscription Apps 2026 by RevenueCat
Why is this happening?
- rising CAC
- pressure for faster monetization
- limiting abuse
- higher operating costs, especially in AI
This is a classic example of the tension between an ideal benchmark and real market conditions.
Only a small percentage of apps reach real scale
The most brutal data from the report concerns how few apps reach a meaningful level of revenue.
Probability of reaching scale within the first 2 years
| Revenue Level | Share of Apps / Percentage of Apps |
|---|---|
| $1,000 MRR | 17% |
| $10,000 MRR | 4.6% |
| $25,000 MRR | even fewer |
In other words, more than 95% of apps never reach serious scale.
What really determines the outcome?
- distribution
- retention
- monetization
These are what determine whether an app becomes a business or just a product.
Not all categories are equal
The report also shows clear differences between categories.
Revenue per install after 14 days
| Category | RPI D14 |
|---|---|
| Health & Fitness | $0.48 |
| Gaming | $0.08 |
This is not a coincidence. Categories differ not only in pricing but, more importantly, in product logic.
Why Health & Fitness monetizes better?
- training programs
- coaching
- long-term plans
- naturally higher subscription value
Why gaming looks different?
- huge user volume
- greater reliance on microtransactions
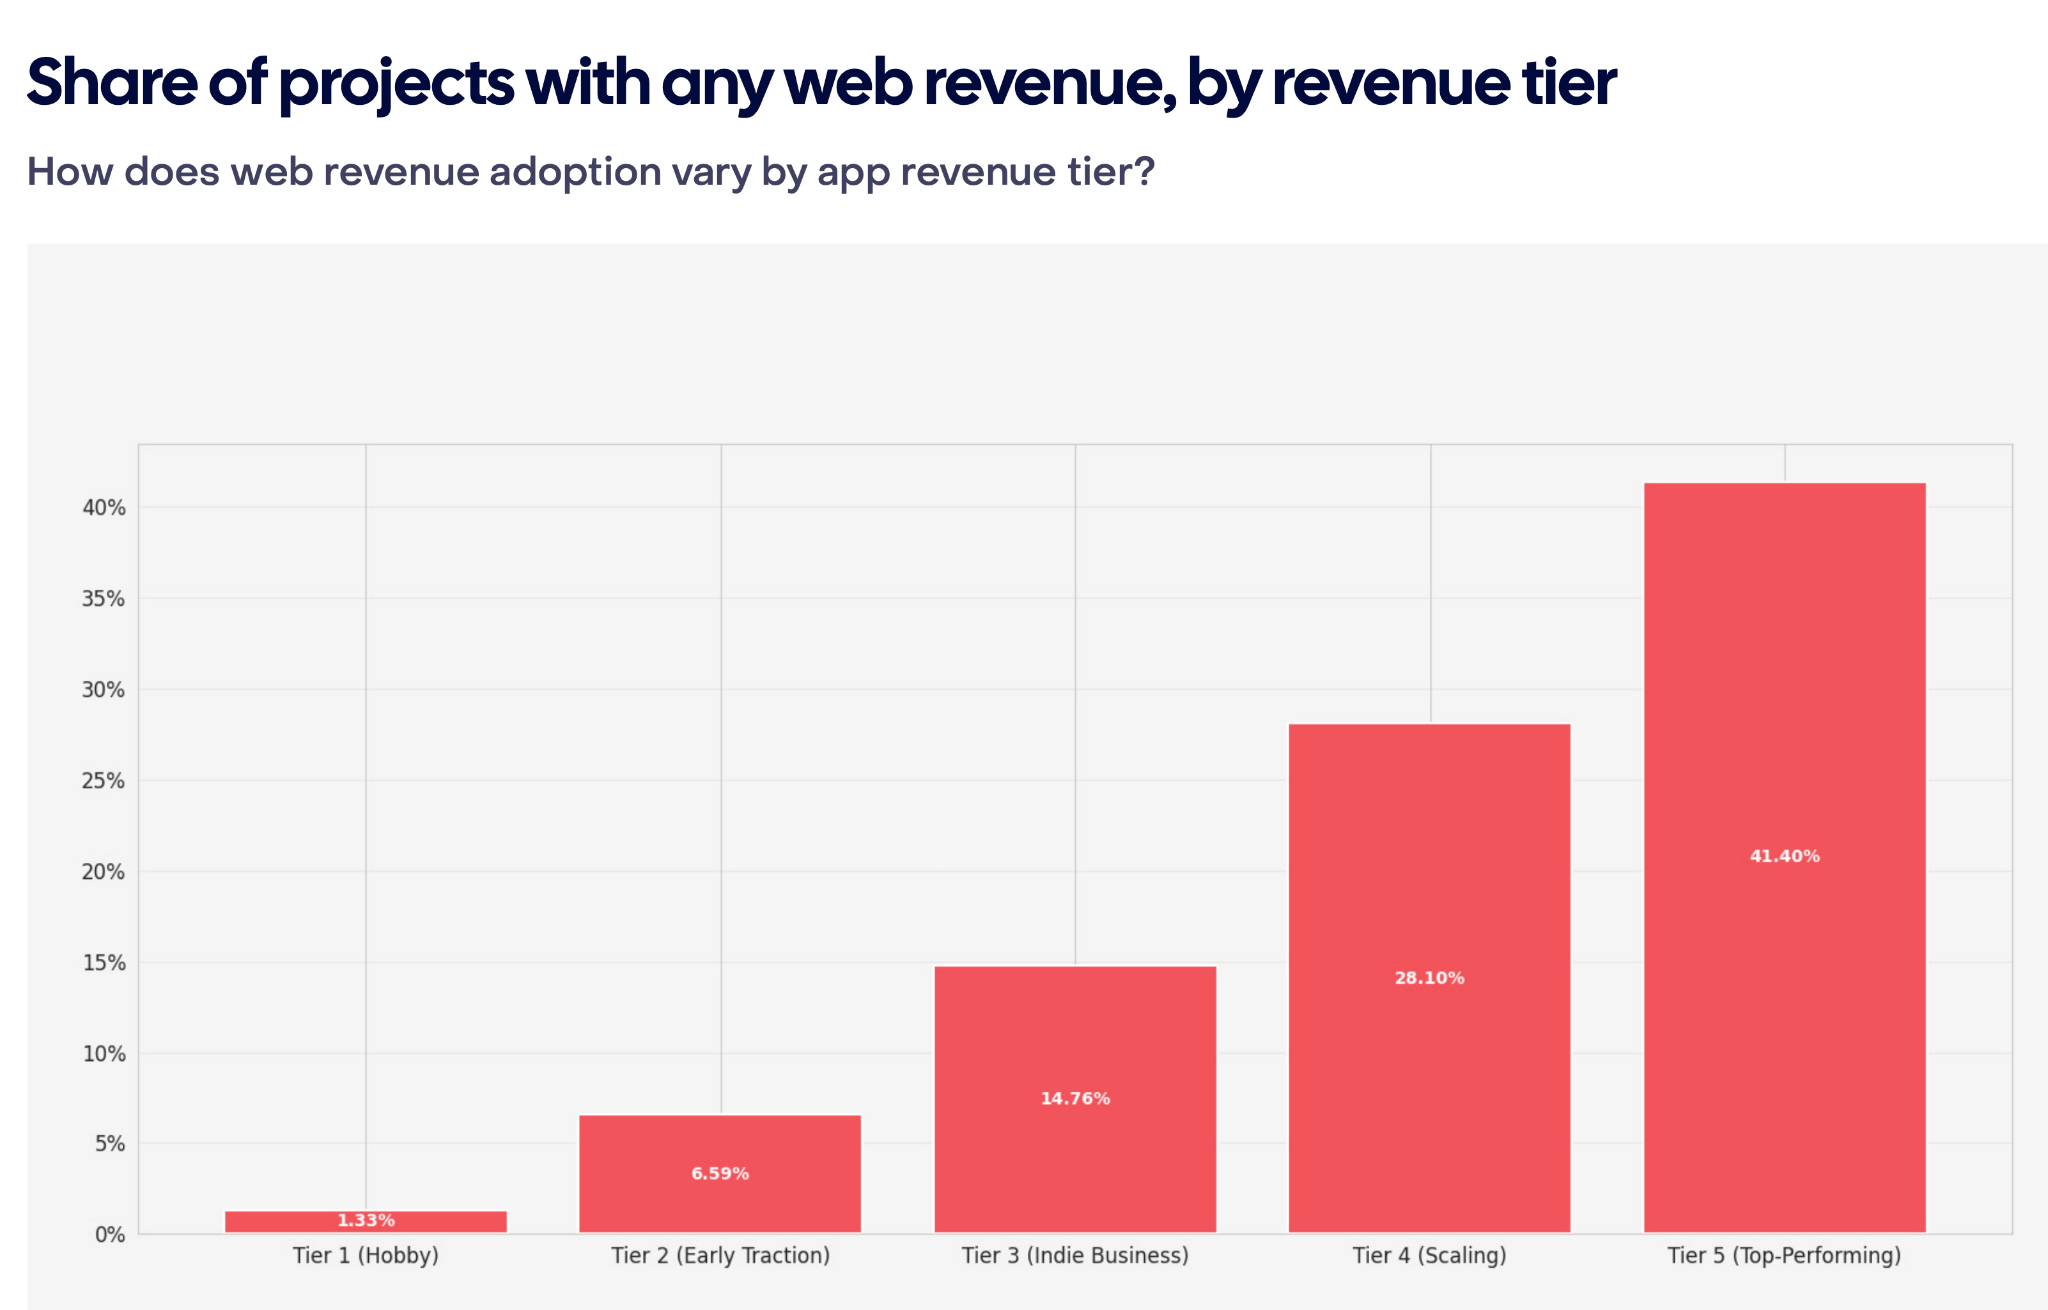
The quiet revolution: web is starting to take revenue from the stores
One of the most interesting trends in the report is the growing role of web-to-app.
Web revenue by app scale
| App segment | Share of apps generating revenue through the web |
|---|---|
| Top apps | 41% |
| Smallest apps | 1.3% |
This is a strategic shift, not a minor optimization.
State of Subscription Apps 2026 by RevenueCat
Why is web gaining importance?
- avoiding App Store and Google Play commissions
- greater control over pricing
- better analytics
- easier and stronger remarketing
- greater control over the purchase funnel
For the best apps, the web is no longer an add-on. It is becoming a fully-fledged monetization channel.
What really determines app success today?
After analyzing the entire report, it becomes very clear that the subscription app market is undergoing a deep transformation.
Building apps has never been easier. But achieving success has never been harder.
Characteristics of the best apps
- a very fast “aha moment”
- exceptionally well-designed onboarding
- an intelligently optimized paywall
- a well-thought-out pricing strategy
- strong user retention
- a better growth system built around the product
This means that the product alone is no longer enough. What matters is the entire growth machine around it.
The most important lesson from the report
If there is one thing founders should take away from the RevenueCat report, it is this: the subscription app market no longer rewards average products.
The barrier to entry has dropped thanks to AI, but competition has increased in return. As a result, only products that truly solve a user problem — and do it better than anything else on the market — will win.
Because in the world of subscription apps, the first purchase is only the beginning. The real business begins when the user stays for the long term.

New Apple Ads Search Placements in 2026
Never in history has building a subscription-based mobile app been so easy. And never...