AppsFlyer has released the 2026 edition of its Performance Index – the mobile media source ranking the company has published every year since 2015. For anyone planning user acquisition budgets for the coming year, it’s one of the most important benchmarks in the industry. In this post I give a short introduction to the report: what’s in it, what has changed compared with previous years, and what to keep in mind before you start moving budgets around.
You can find the full report here: AppsFlyer Performance Index 2026
The report in numbers
- 27.2 billion installs from nearly 25,000 apps
- 57 media sources (ad networks and platforms)
- analysis period: April 2025 – June 2026
- user acquisition and remarketing rankings for iOS and Android, broken down into up to 10 genres/categories and 11 regions
- the second edition of the Creative Index, which ranks networks by video format (gameplay, UGC, animation)
For comparison: the 2025 edition covered 16.2 billion installs, 39,000 apps and as many as 88 media sources. So the install sample is bigger, but the list of ranked networks has shrunk noticeably.
The biggest change: quality measured by spend, not retention
Each media source gets two positions in the report:
- Volume rank – how many installs the network delivers,
- Power rank – a combination of volume and a quality measure.
Until now, quality meant user retention. In 2026, AppsFlyer replaced it with the quarter-over-quarter change in ad spend. The logic is simple: if advertisers keep putting more money into a network, they are probably seeing a return there – ROAS, LTV, revenue – which a retention curve alone doesn’t show.
That does change what a top position in the ranking means, though. Today, power rank says “this is where the market is moving its budgets” rather than “this is where users stick around the longest”. Spend also grows for reasons that have little to do with traffic quality: seasonality, pricier auctions, a few big advertisers. The practical consequence: this year’s power ranking can’t be compared directly with last year’s. The volume rankings are still comparable.
Who leads in 2026
Top 5 in the global power ranking across four key segments:
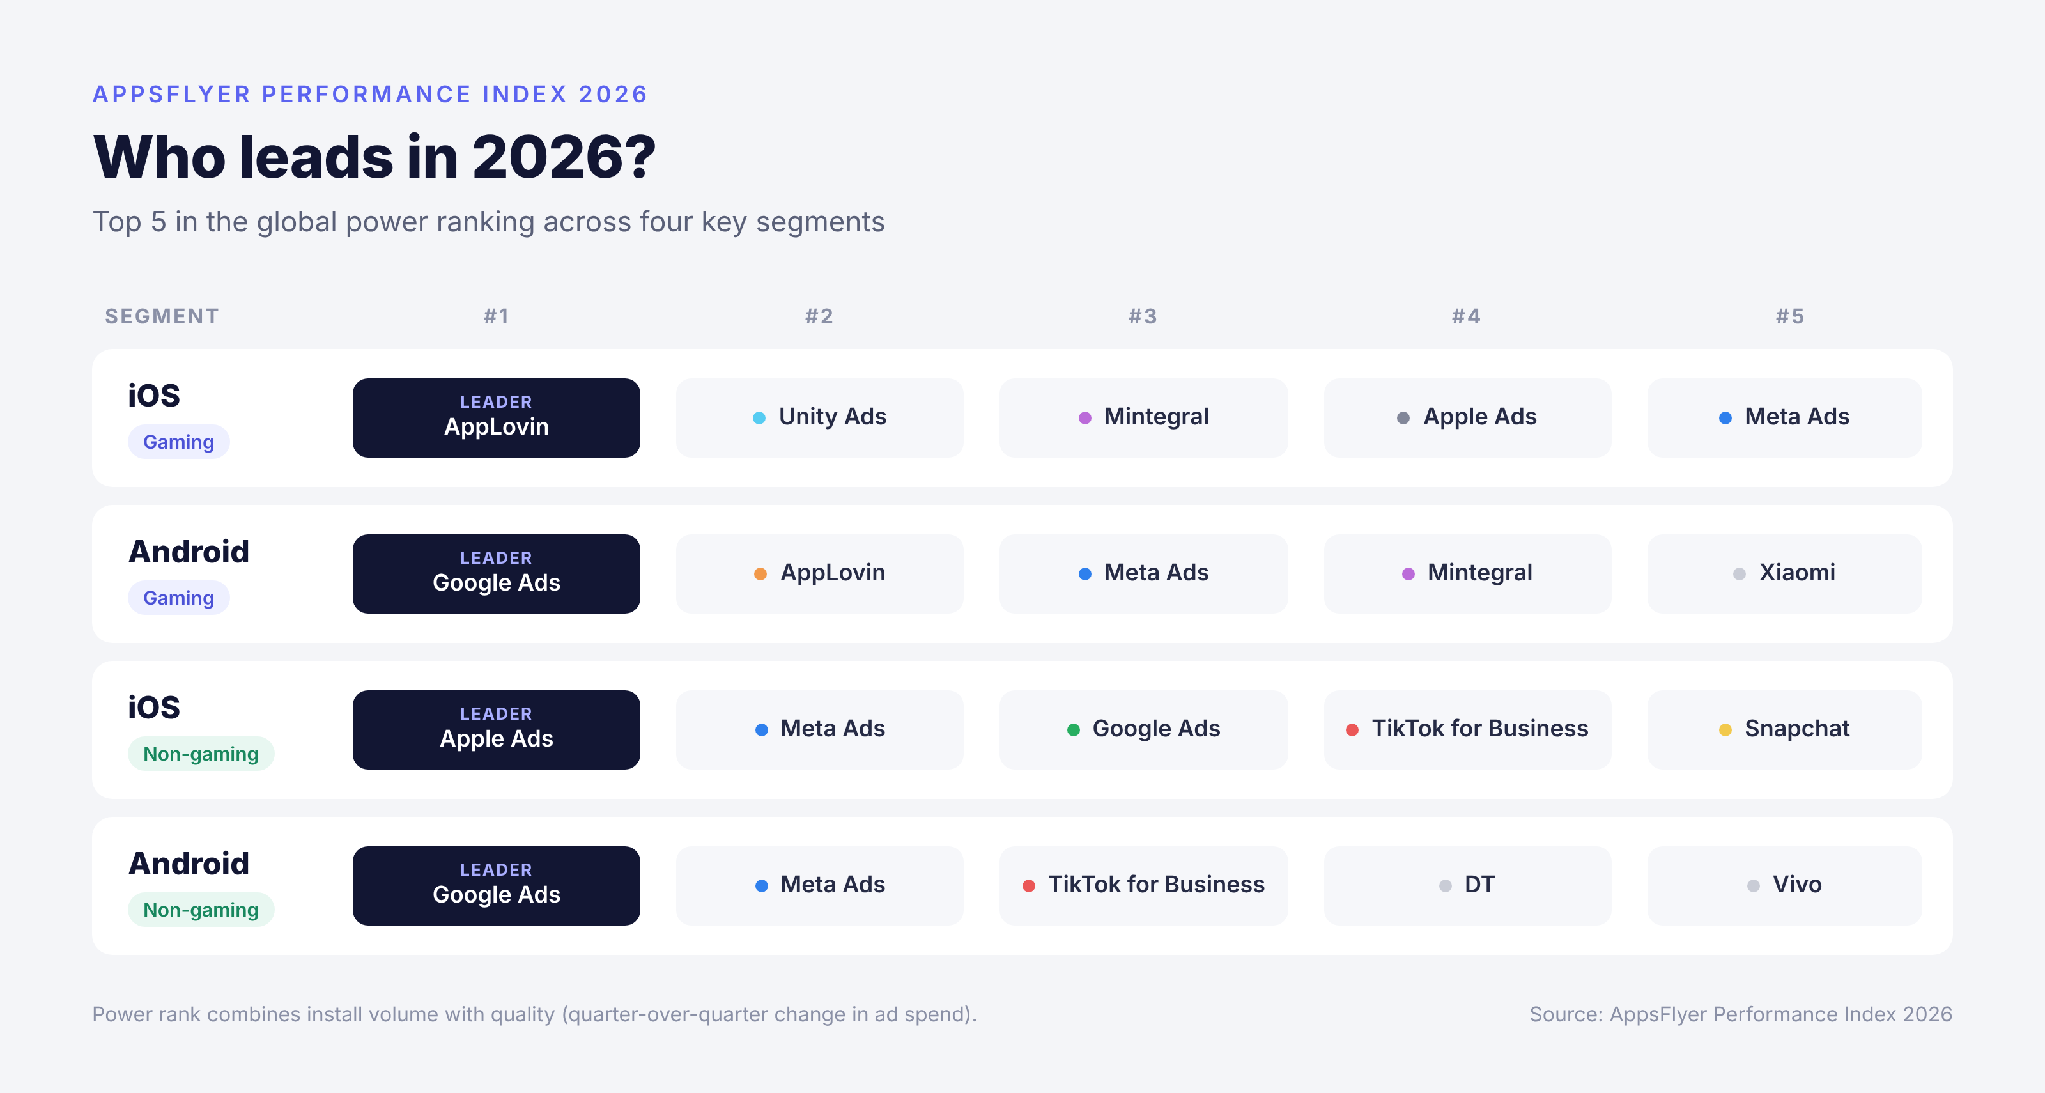
In remarketing, Meta Ads takes the lead. A year earlier Google was on top here, and Meta only won iOS non-gaming remarketing, which makes this one of the more interesting shifts in this edition.
Trends worth noticing
The market is growing, but it’s getting more expensive. 9 of the top 10 media sources and 17 of the top 20 increased ad spend year over year – on iOS and Android, in gaming and beyond. AppsFlyer links this both to a rise in conversions and to rising media costs, so part of that growth is simply a higher CPI.
AppLovin clearly dominates iOS gaming. It ranks first in both power and volume. In last year’s edition, Apple Ads led iOS gaming; it has now dropped to fourth place. Note: because of the methodology change, this comparison is only indicative.
Unity Ads is back in the game. Second place in the iOS gaming power ranking, despite fifth place by volume. AppsFlyer attributes this to demand being moved from ironSource to Unity Ads.
OEMs are growing on Android. Xiaomi climbed six positions by volume in gaming (to 8th place), and OPPO and Vivo gained as well. In non-gaming apps, DT ranks fourth in power thanks to pre-installs rather than auction bidding.
Creatives matter. In the gaming Creative Index, Mintegral performs best, leading among others in the gameplay and UGC categories.
Context worth keeping in mind
In June 2026, Google, Meta, Moloco and Unity took minority stakes in AppsFlyer (at a $2.7 billion valuation), and all four companies appear in the ranking. AppsFlyer states that the investors get no preferential treatment in attribution or data. This doesn’t undermine the report, but it’s worth knowing when you read the rankings.
How to read the report as a UA manager
- Go from the global level down to region and genre. The global leader isn’t necessarily the best choice for your casual game in Western Europe or your subscription app in Poland. The full report has regional and genre rankings – that’s where most of the value is.
- Compare power with volume. A network with a high power rank and lower volume (like Unity Ads in iOS gaming or DT on Android) is often a channel that still has room to scale.
- Remember what power rank measures. This year it’s “where advertisers are adding budget”, not “where users retain best”. That difference matters when you’re working with small budgets.
- Treat the ranking as a list of things to test, not a ready-made strategy. Only your own cohort and ROAS analysis will give you the final answer.
You can find the full report here: AppsFlyer Performance Index 2026

Peter Plachta
Founder, ARPU Brothers, (Experienced Mobile User Acquisition & ASO Expert since 2012) - Achieved over 240 million app and game installs