Insights from RevenueCat’s 2025 Report: LTV, Paywalls, and Pricing
The mobile app market is a living organism, pulsing with change and innovation. At the epicenter of this transformation are subscription models, which are becoming increasingly important year after year. At ARPU Brothers, we’re passionate about tracking these trends, and today we’d like to share with you the key insights from the State of Subscription Apps 2025 report. This knowledge-packed compendium, based on an analysis of over 75,000 apps generating more than $10 billion in revenue in 2024, offers fresh perspective on monetization strategies, user acquisition, and ARPU maximization. Buckle up – we’re about to dive into the key data points that will define success in 2025!
The Subscription App Landscape in 2025: Key Trends
2025 is shaping up to be a year of rapid growth and increasingly sophisticated strategies in the world of subscription-based apps. The report highlights several key trends that will shape the market:
- Dominance of AI apps: Artificial Intelligence is not a passing trend. AI-powered apps are not only gaining popularity but are also outperforming traditional categories in terms of revenue, retention, and LTV. Today, when browsing the App Store or Google Play, you’re likely to come across hundreds of new apps for solving homework, taking notes, or calorie calculators that can estimate nutritional values from a photo.
- Hybrid monetization models: More and more apps—over 35% already—combine subscriptions with one-time purchases or lifetime deals. Leading the way are Gaming (61.7%) and Social & Lifestyle (39.4%) apps.
- Conversion optimization from day one: Rapid user engagement is becoming critical. There’s no time to waste!
- Rising user acquisition costs (UA): The rise in CPI and CPPU (Cost Per Paying User) is forcing a focus on users with high Lifetime Value (LTV), rather than sheer install volume.
- Web-to-app funnels: Funnels that lead users from web platforms to mobile apps are becoming a promising strategy for reducing acquisition costs and reaching new audiences.
- Growth of cross-platform technologies: React Native and Flutter are gaining popularity, offering strong revenue potential. However, retention for these technologies may still require additional optimization.
Interestingly, the revenue gap between top performers and the rest is widening. The top 5% of newly launched apps generate an average of $8,888 in their first year—that’s 400 times more than the bottom 25%, which earn just $19. This underscores the importance of having a well-thought-out strategy from day one.
Conversion: From First Tap to Loyal Subscriber
The path from app install to paying subscriber is filled with challenges, but the report provides valuable insights on how to optimize it. The key lies in understanding user behavior and acting fast.
Trial Period Dynamics
Free trials are a powerful tool—but their effectiveness depends on multiple factors:
- Speed matters: A striking 82% of trial starts occur within the first day after app install. This highlights how critical that initial user experience is.
- Longer trials = higher conversion: Trials lasting between 17–32 days show the highest median trial-to-paid conversion rate—45.7%.
- Price affects trial opt-in: Interestingly, apps with higher subscription prices see better trial conversion rates—median of 9.8% for high-priced apps vs. 4.3% for lower-priced ones.
- Top trial-to-paid performers: Travel apps lead the way with a median trial-to-paid conversion rate of 48.7%, followed closely by Media & Entertainment apps at 43.8%.
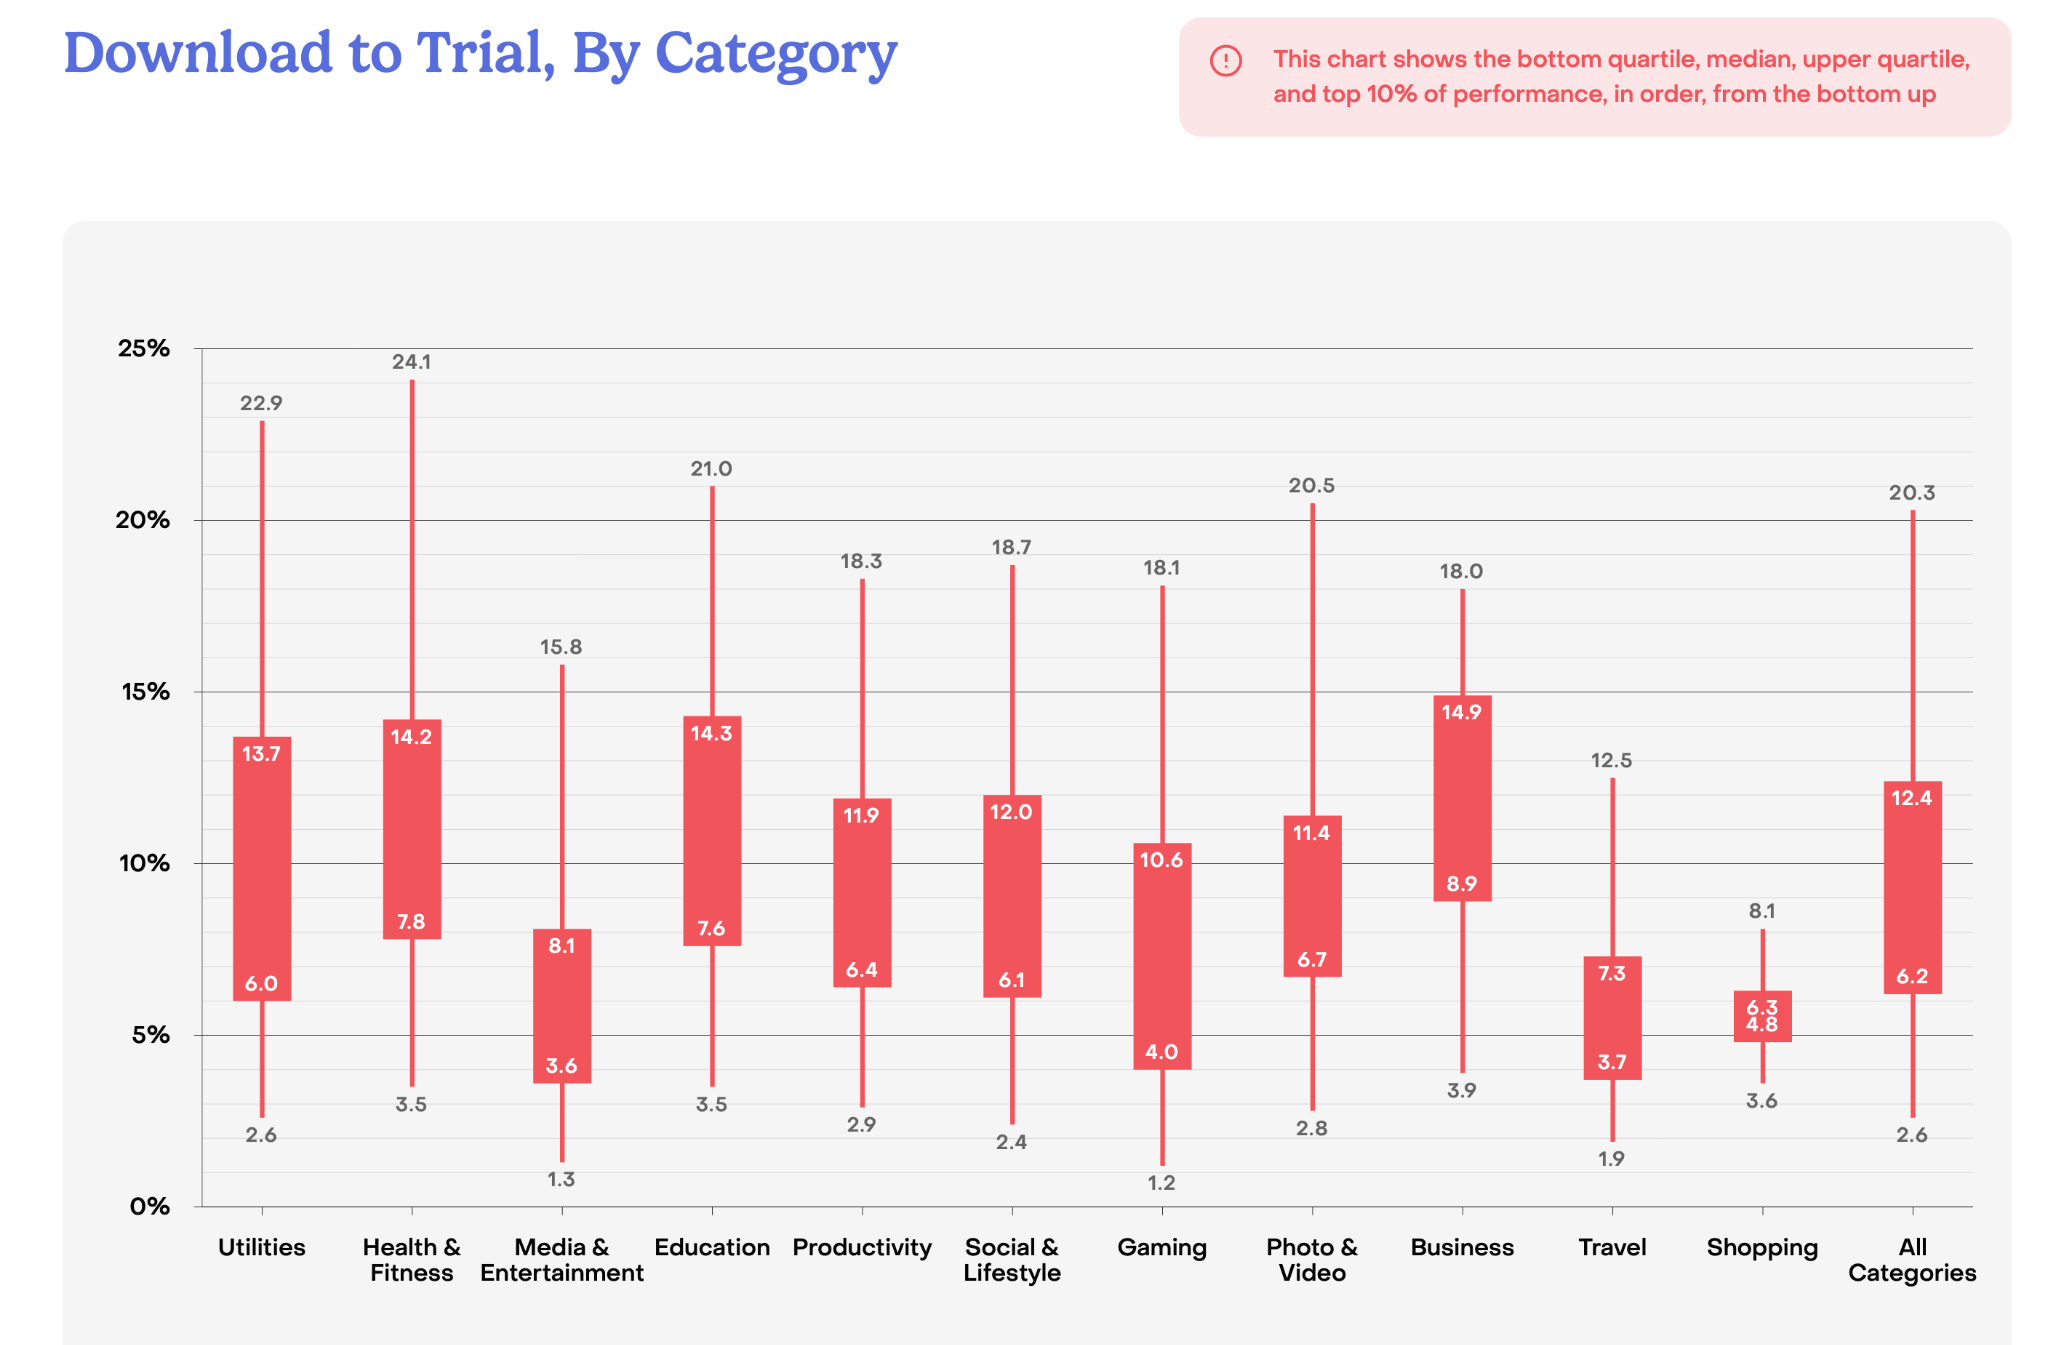
It’s important to note that the shortest trial lengths (3-day and 7-day) have the highest cancellation rates on Day 0 and Day 1.
Always test different trial durations and measure both trial opt-in rates and trial-to-paid conversions to find the sweet spot for your app.
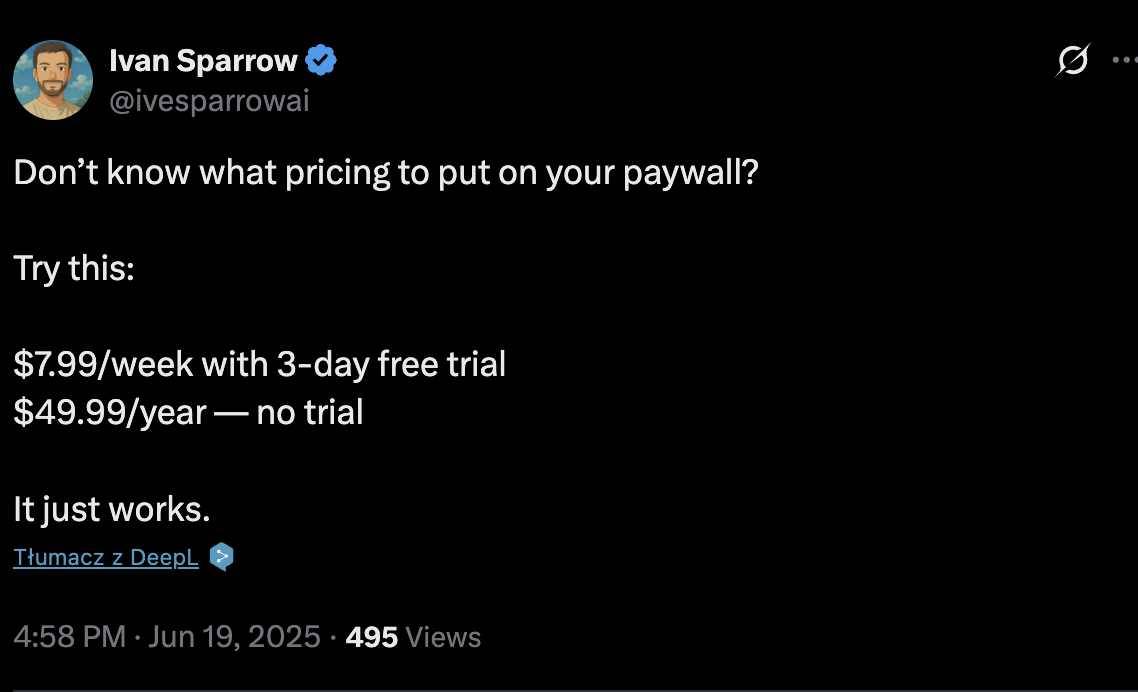
Pro tip: Follow mobile app founders on Twitter who openly share their insights and real-world learnings. Their experiences can be a goldmine for improving your own strategy.
The Power of Paywalls and Regional Differences
Your monetization model has a direct impact on conversion rates. Apps using a hard paywall—requiring a subscription to access core features—convert downloads to paying users far more effectively than freemium models. The median download-to-paid conversion rate for hard paywalls is 12.11%, compared to just 2.18% for freemium apps.
Geography also plays a significant role.
North America leads in download-to-paid conversions, with 5.5% in the upper quartile and a remarkable 10.5% for the P90 percentile. In contrast, emerging markets such as Latin America and the MEA region report median conversion rates below 0.2%.
ARPU Brothers Insight: Focusing on funnel optimization from day one, offering strategically timed trials, and making intentional choices around your paywall model are foundational pillars for maximizing ARPU. The data shows that even small improvements in these areas can lead to significant revenue growth. And always remember to A/B test different trial lengths and paywall strategies.
The Pricing Game: How Subscription Prices Impact Revenue and LTV
Pricing your subscription is one of the toughest challenges. The report confirms there’s no one-size-fits-all solution—optimal pricing depends on your app category, region, plan length, and perceived value.
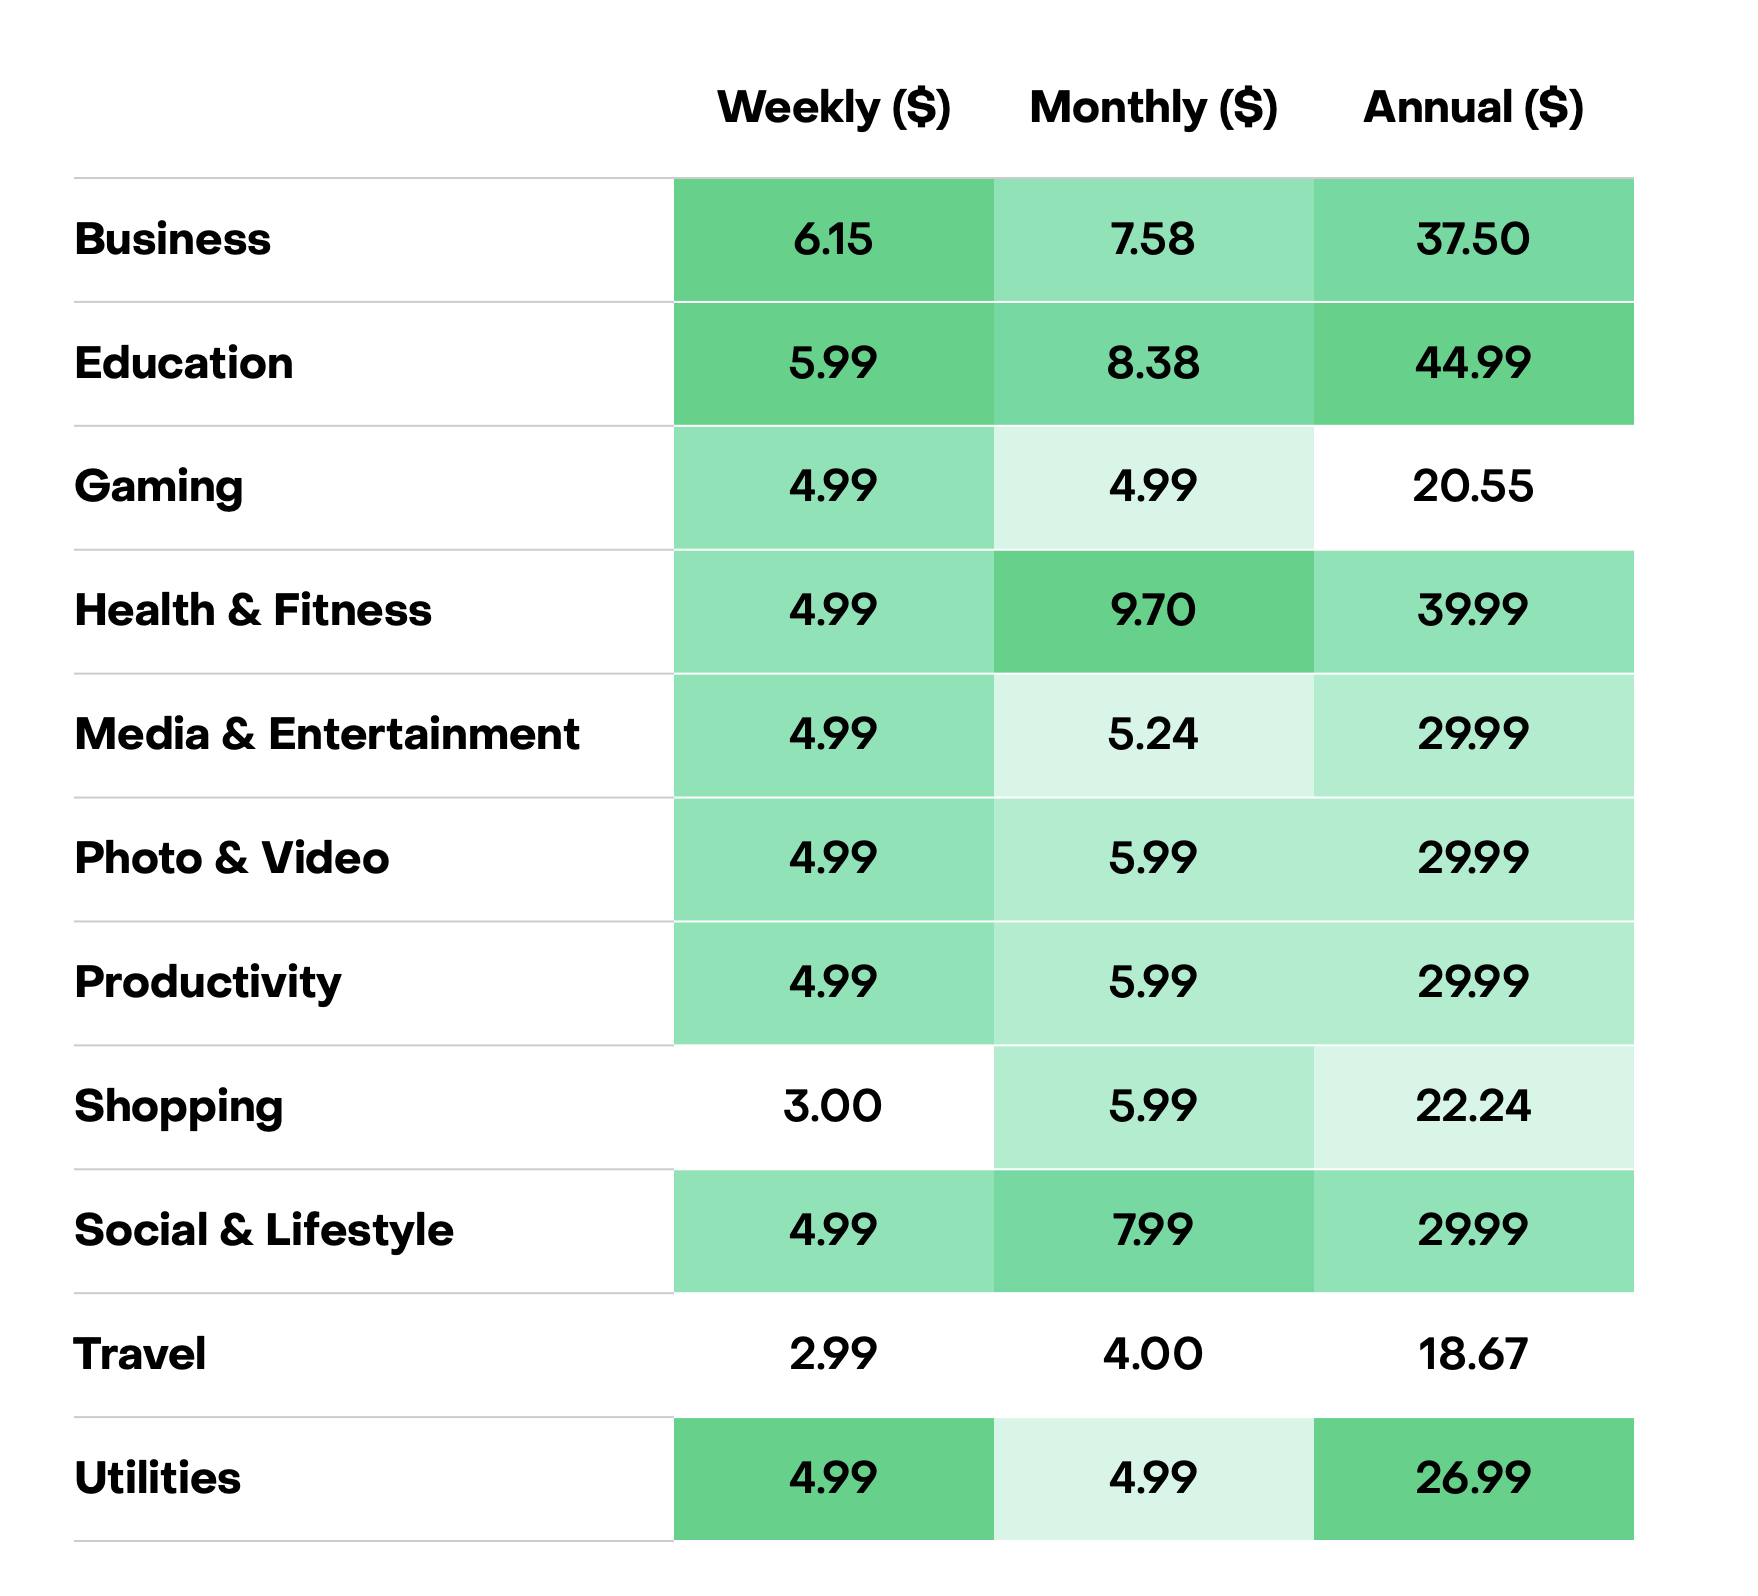
- Discounts for longer-term plans:
A clear trend is offering attractive discounts on longer commitments. For example, in the Health & Fitness category, the median annual plan is priced at $29.65, which is 3.8x the monthly price of $7.73. In the Education category, the difference is even greater—$43.94 annually versus $8.13 monthly, a 5.4x multiple. - Higher prices = higher LTV:
More expensive plans drive significantly higher customer lifetime value (LTV). Apps with high-priced plans achieve a median LTV of $55.21, while those with lower-priced plans only reach $8.08—a staggering 7x difference. - Regional price variation:
Pricing strategies vary widely by market. For instance, App Store subscriptions tend to be more expensive than Google Play, except in North America, where the trend reverses.
User Lifetime Value (LTV) increases by nearly 60% on average from month one to month twelve across all categories, underscoring the importance of long-term pricing and retention strategies.
Retention: Keeping a Customer Is Both an Art and a Science
Acquiring a user is just the beginning. The real challenge—and the key to sustainable ARPU growth—is retention. Unfortunately, the data shows that holding on to subscribers is hard, with overall retention rates slightly declining year-over-year.
- Annual plans lead in retention:
Apps offering annual subscriptions show significantly stronger retention. After one year, 36% of users on low-priced annual plans remain subscribers, compared to just 6.7% on high-priced monthly plans. Overall, 12-month retention for annual plans ranges from 50–60%, while monthly plans see 20–40%, and weekly plans fall below 10%. - The first month is critical for annual plans:
Nearly 30% of annual subscriptions are canceled within the first month. - Declining retention rates:
Median retention for annual plans has slightly dropped from 47.1% to 44.1%. Similarly, monthly plans fell from 18.8% to 17.0%, and weekly plans from 4.2% to 3.4%. - The first renewal is a major churn point:
The highest churn happens at the first renewal: 30–50% for weekly plans and 15–40% for monthly ones. However, retention improves significantly after the first renewal—median weekly plan retention jumps from 53.6% at the first renewal to 75.3% at the second. - Refunds remain a pain point:
Refund rates are especially high in some categories—Education (4.86%), Health & Fitness (4.71%)—and for apps with hard paywalls (5.8% vs. 3.4% for freemium models).
User Acquisition: Rising Costs, Evolving Strategies
In today’s competitive landscape, acquiring new users is becoming increasingly expensive. This shift is forcing developers and marketers to rethink their approach—from driving mass installs to targeting high-LTV users with precision.
- High CPI and CPPU:
The Cost Per Install (CPI) on iOS is significant for some categories—Photo & Video apps average nearly $15, while Books & Reference are close to $14.50. What’s more, the Cost Per Paying User (CPPU) is typically 4–5 times higherthan CPI. Naturally, acquisition costs vary depending on the ad network and targeting strategy. - AI drives acquisition costs up:
Globally, AI-focused apps see CPI above $10 on iOS. Interestingly, in North America, Android CPI for AI apps is much lower—below $4. - Focus on LTV:
Long-term success depends on attracting users who not only install your app but also stick around and generate revenue over time. - Web-to-app as a cost-effective alternative:
Funnels that move users from a website to the app store (web-to-app) are becoming a promising strategy for reducing acquisition costs and reaching wider, intent-driven audiences.
Not all installs are created equal. Investing in analytics and user segmentation helps optimize ad spend and ensures better budget allocation toward users with high potential.
ARPU Brothers Insight: As UA costs rise, ARPU optimization is more critical than ever. Strategies like web-to-app funnels, precise targeting, and continuous improvement of the user experience to boost LTV are the levers you need to focus on in 2025 and beyond.
Clash of the Titans: App Store vs. Google Play
The ongoing rivalry between iOS and Android is clearly reflected in monetization data. The report reveals key differences that should be considered when planning your strategy.
- Revenue: Most apps generate the majority of their revenue from the App Store. In every region, over 67% of apps report that at least 80% of their revenue comes from iOS.
- Pricing and conversion: The App Store typically features higher annual subscription prices and consistently outperforms Google Play in day-35 download-to-paid conversion rates (D35).
- Revenue Per Install (RPI):
The App Store consistently leads in D60 RPI, with a median of $0.38 compared to $0.14 on Google Play. - LTV:
Categories such as Business and Health & Fitness show the highest Lifetime Value (LTV) on both platforms, with median LTV exceeding $25. - Offer adoption:
Promotional offer adoption is significantly higher on the App Store (17.6%) than on Google Play (7.3%). - Exceptions:
Google Play can outperform the App Store in trial-to-paid conversion rates for certain categories—e.g., Business (42.6%) and Media & Entertainment (41.2%).
These differences highlight the need to tailor your monetization and user acquisition strategies to the unique dynamics of each platform.
Star of the Year: AI Apps Are Changing the Game
Artificial Intelligence is undeniably the hottest trend in tech, and AI-powered apps are redefining the rules of the subscription market. The numbers speak for themselves:
- Revenue Per Install (RPI):
AI apps generate 60-day RPI exceeding $0.63, on par with the Health & Fitness category ($0.63), and double the overall median ($0.31). - Monetization without trials:
Surprisingly, 86% of AI apps do not offer a free trial—only 14% use trial-based models. - Platform differences in AI:
AI apps on the App Store outperform those on Google Play in monetization, with 60-day median RPI of $0.69 on iOSvs. $0.24 on Android. - LTV and retention in AI:
Long-term LTV is comparable across platforms for AI apps (annual median of $37.80 on iOS and $35.99 on Android). Interestingly, Google Play shows stronger long-term retention for paying users of AI apps (median annual retention of 11.5% vs. 9.2% on App Store).
AI mobile apps are a fast-growing segment, already demonstrating massive monetization potential and reshaping user expectations.
New Tech Horizons: React Native, Flutter, and Web-Based Billing
The tech stack for subscription apps is also evolving. The report highlights the growing role of cross-platform technologies and web-based payments.
- React Native and Flutter: Development with React Native and Flutter is on the rise. Data points to their increasing revenue potential:
- React Native leads in median D35 download-to-paid conversion (2.2%).
- Flutter outperforms in P90 14-day RPI ($1.55 vs. $1.11 for native apps).
- React Native delivers the highest long-term LTV per paying user (median $22.80).
- However, retention for cross-platform apps still requires further optimization to match native performance.
- Web-Based Billing: A growing trend offering greater pricing flexibility and access to new audiences. While it comes with added implementation complexity, web billing can be a powerful alternative or complement to in-app payments. In fact, Business apps using web models lead in median LTV ($255) and report the lowest churn rates.
As shown in the State of Subscription Apps 2025 report, the subscription app space is now more dynamic and competitive than ever. Winning in 2025 will require:
- Agility,
- Data-driven thinking,
- And strategic decision-making based on hard numbers.
From conversion optimization and smart pricing strategies to strong retention efforts and innovative user acquisition tactics—every part of the puzzle matters.
The rise of solo mobile app creators—so-called solo entrepreneurs—building subscription-based apps alone. Their typical goal? To reach $10K–$20K in Monthly Recurring Revenue (MRR) within their first year.
So… how is your app performing in comparison?

Did the App Store (ASO) algorithm really change – or is it just a fluke?
The mobile app market is a living organism, pulsing with change and innovation. At...